I’m not sure how much more is worth saying about appropriation, orifices like the RIAA /MPAA, and the sad state of copyright law. Lawrence Lessig’s free culture pitch articulates the history of copyright and the necessity of a commons with plenty of precision and conviction. Clearly, any spirit of creative protection in copyright law has lost out to greed. Our best (and last) hope is either the noble contrarians at Creative Commons, or the collective realization that we’re all felons in the eyes of copyright law, so the law had better change. I wouldn’t bet on either.
So, Marshall McLuhan’s work held my interest more tenaciously than Susan Meiselas’s self-righteous kvetching or Shepard Fairey’s (perhaps predictable?) back-stabbing dishonesty.
McLuhan’s take on the significance of how we communicate (rather than what we communicate) is often renowned as creepily prescient of modern times. I should reserve judgment until I’ve finished the book, but once again I think the web and computation have disrupted the thesis. Unlike print, or radio, or television, or film, computational media lend themselves to transmogrification between traditional forms. How could you begin to classify the web as hot or cold, when it entangles so many divergent media into one? At ITP, it seems like our mode of production emphasizes creation and manipulation of media over content, a lateral move that might emphasize McLuhan’s “medium is the message” conclusion.
[ For discussion: The problem with digital abstraction… who can own a sequence of bits, when the content actually lies in the interpretation of that data, and not necessarily in the sequence itself? For example, I could write a song that happened to use the exact same bit sequence that describes Meiselas’s molotov man. When the bits are played as an mp3, it’s one thing, when interpreted as, say, a jpeg, they become something else. Who owns what? Can you really own a string of 0s and 1s that could have been generated and interpreted in any number of ways? ]
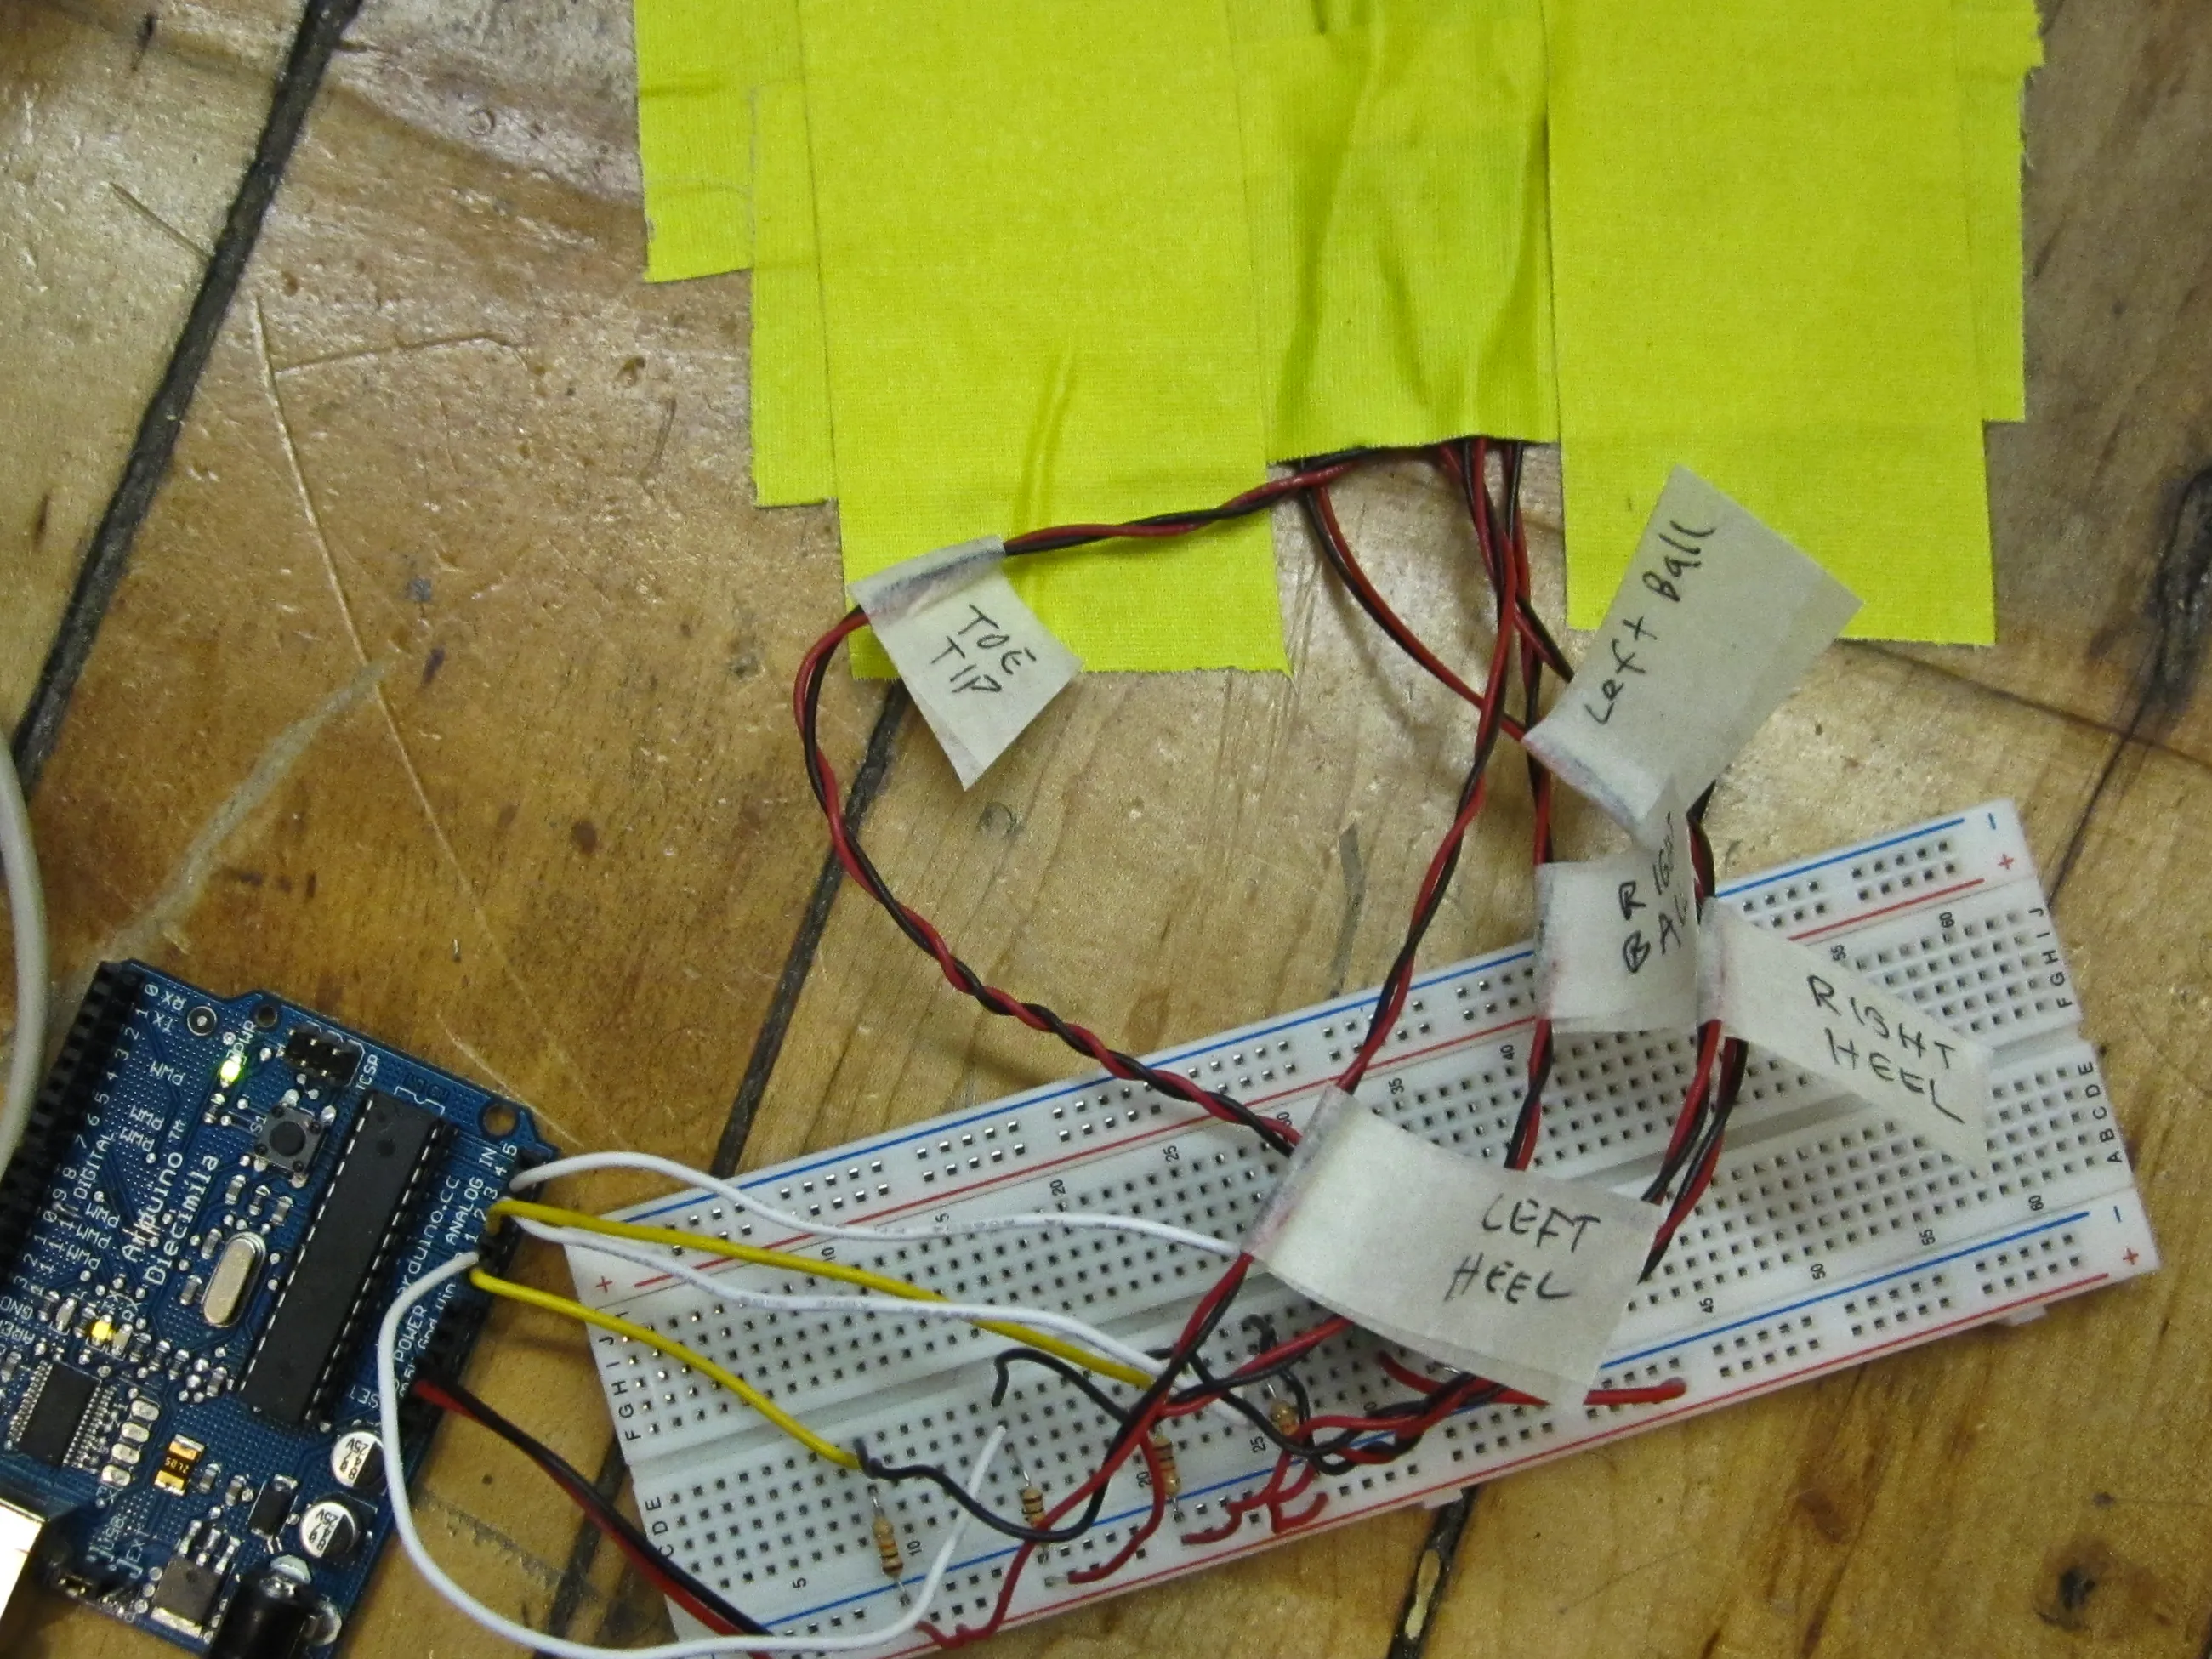
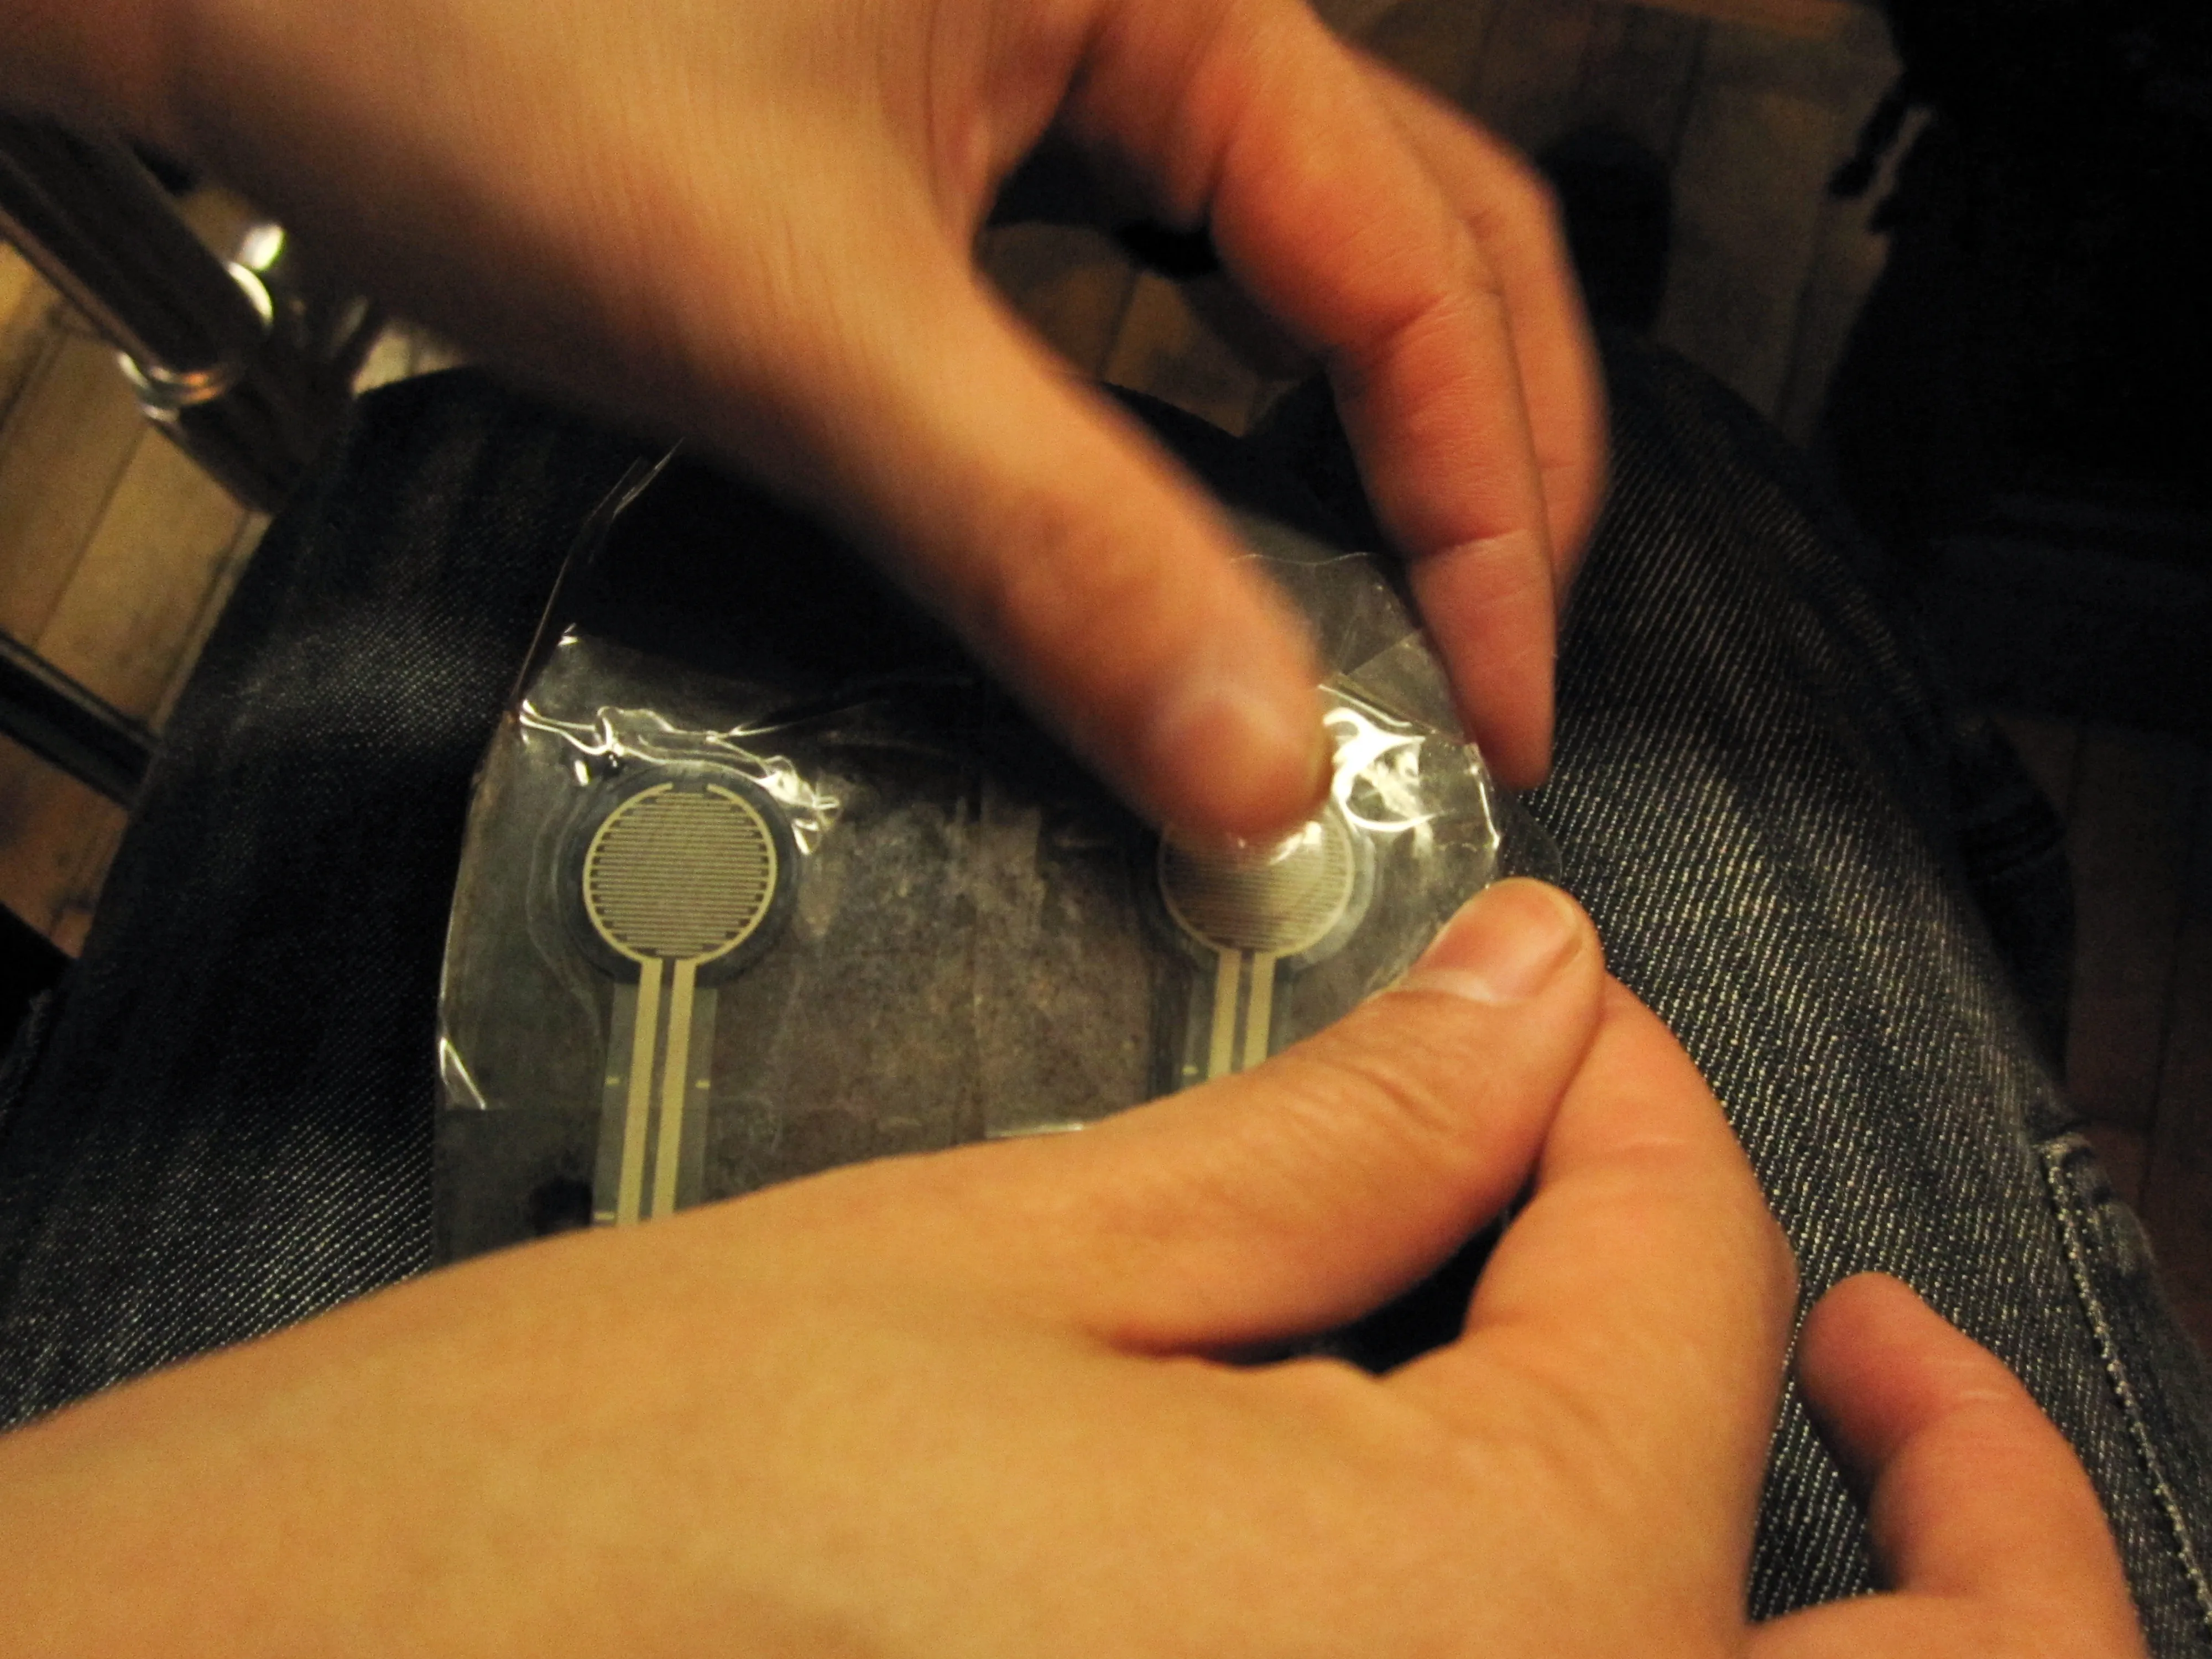
Yin, Arturo, and I have started implementing a tap-inspired musical shoe. Right now we’re working on a single shoe, with 5 force sensitive resistors (FSRs) on the bottom designed to capture nuances of a foot fall and translate them into sounds (either sampled or synthesized, we’re not sure yet.)
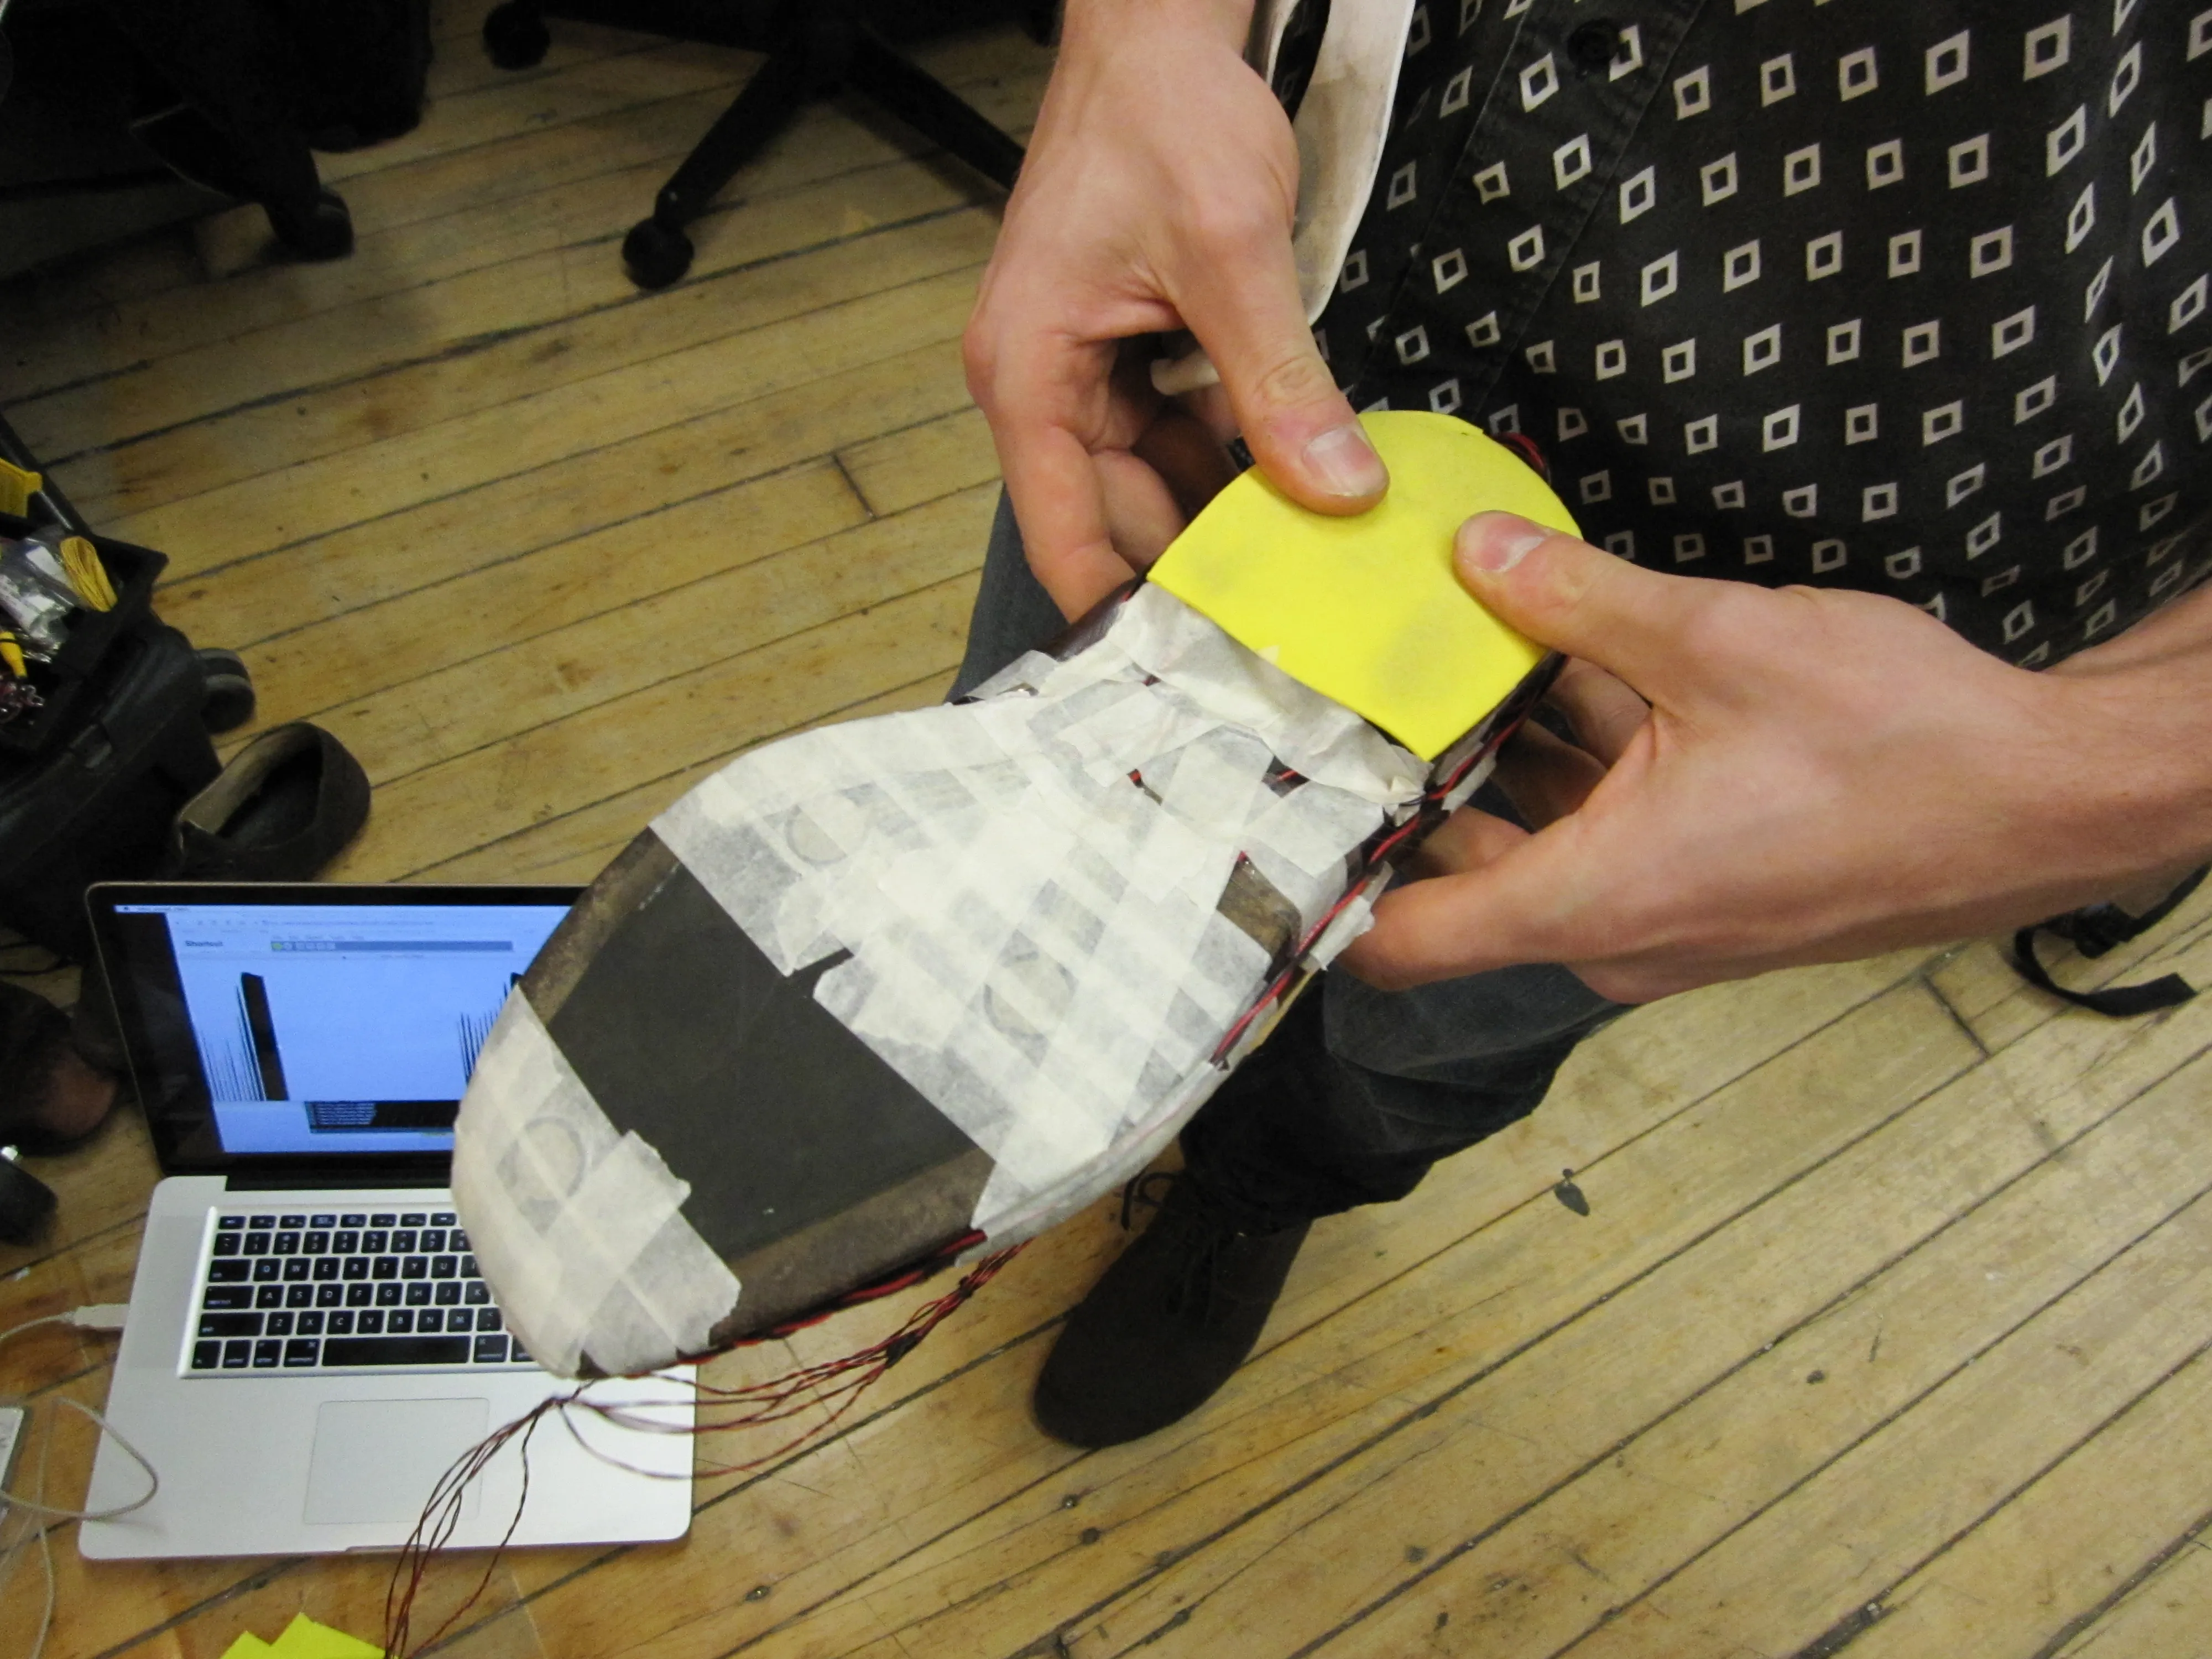
Here’s how the system looks so far:
On the bottom of the shoe, there’s a layer of thin foam designed to protect the FSRs and evenly distribute the weight of the wearer. We ran into some trouble with the foam tearing on cracks in the floor, so we’re looking for a way to improve durability or maybe laminate something over the foam to protect it.
The challenge now is to find a way to work with all of the data coming in from each foot… how best to map the FSR’s response to the wearer’s movements in an intuitive and transparent way. On technical fronts, we’re going to need to make the system wireless so the wearer will have freedom of movement, and find a way to route the sensor wires in a more subtle way. There are also concerns about the long-term durability of the FSRs, so we might need to make them easily replaceable. This could be tricky since each sensor is buried under foam and tape…
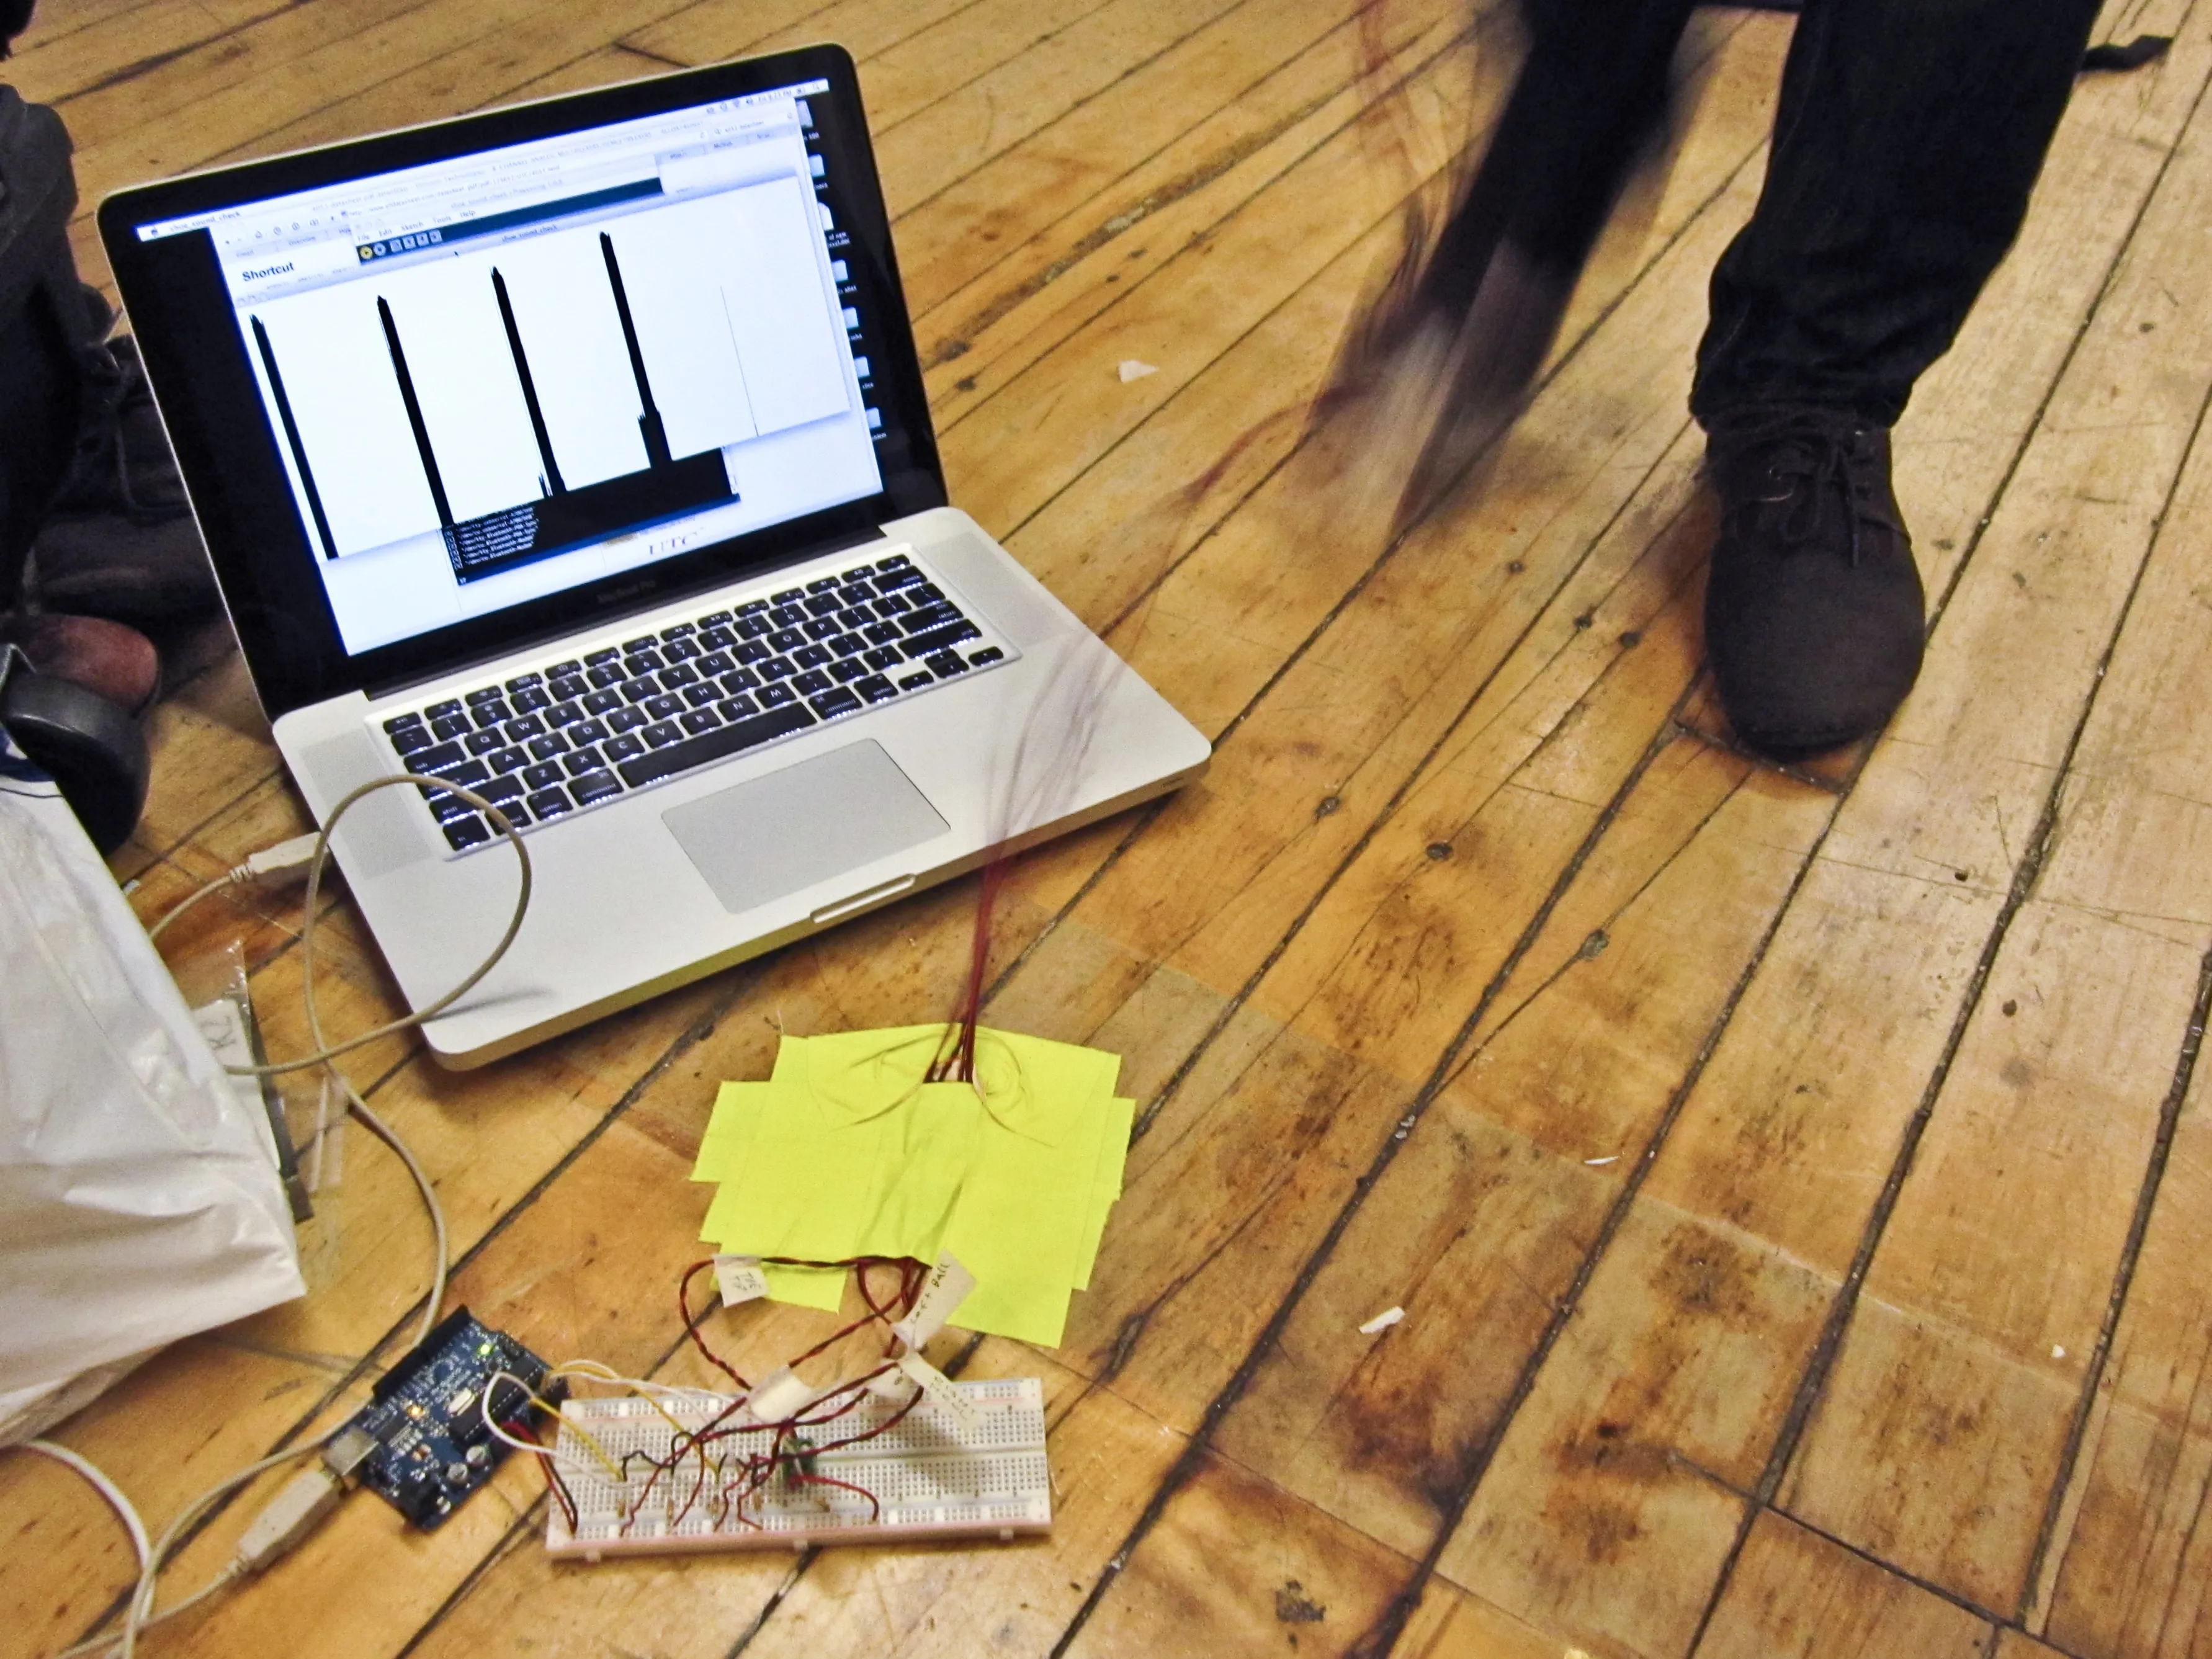
We’ve written some very basic code for now, just enough to get the signal from each FSR and graph the response in Processing.
Here’s the Arduino code:
// Multi-channel analog serial reader.// Adapted from "sensor reader".// reads whichever pins are specified in the sensor pin array// and sends them out to serial in a period-delimited format.// Read the inputs from the following pins.int sensorPins[] = { 0, 1, 2, 3, 4, 5};// Specify the length of the sensorPins array.int sensorCount = 6;void setup() {// Configure the serial connection:Serial.begin(9600);}void loop() {// Loop through all the sensor pins, and send// their values out to serial.for (int i = 0; i < sensorCount; i++) { // Send the value from the sensor out over serial. Serial.print(analogRead(sensorPins[i]), DEC); if (i < (sensorCount - 1)) { // Separate each value with a period. Serial.print("."); } else { // If it's the last sensor, skip the // period and send a line feed instead. Serial.println(); }}// Optionally, let the ADC settle.// I skip this, but if you're feeling supersitious...// delay(10);}
And the Processing code:
// Multi-channel serial scope.// Takes a string of period-delimited analog values (0-1023) from the serial// port and graphs each channel.// Import the Processing serial library.import processing.serial.*;// Create a variable to hold the serial port.Serial myPort;int graphXPos;void setup() {// Change the size to whatever you like, the// graphs will scale appropriately.size(1200,512);// List all the available serial ports.println(Serial.list());// Initialize the serial port.// The port at index 0 is usually the right one though you might// need to change this based on the list printed above.myPort = new Serial(this, Serial.list()[0], 9600);// Read bytes into a buffer until you get a linefeed (ASCII 10):myPort.bufferUntil('\n');// Set the graph line colorstroke(0);}void draw() {// Nothing to do here.}void serialEvent(Serial myPort) {// Read the serial buffer.String myString = myPort.readStringUntil('\n');// Make sure you have some bytes worth reading.if (myString != null) { // Make sure there's no white space around the serial string. myString = trim(myString); // Turn the string into an array, using the period as a delimiter. int sensors[] = int(split(myString, '.')); // Find out how many sensors we're working with. int sensorCount = sensors.length; // Again, make sure we're working with a full package of data. if (sensorCount > 1) { // Loop through each sensor value, and draw a graph for each. for(int i = 0; i < sensorCount; i++) { // Set the offset based on which channel we're drawing. int channelXPos = graphXPos + (i * (width / sensorCount)); // Map the value from the sensor to fit the height of the window. int sensorValue = round(map(sensors[i], 0, 1024, 0, height)); // Draw a line to represent the sensor value. line(channelXPos, height, channelXPos, height - sensorValue); } // At the edge of the screen, go back to the beginning: if (graphXPos >= (width / sensorCount)) { // Reset the X position. graphXPos = 0; // Clear the screen. background(255); } else { // Increment the horizontal position for the next reading. graphXPos++; } } }}
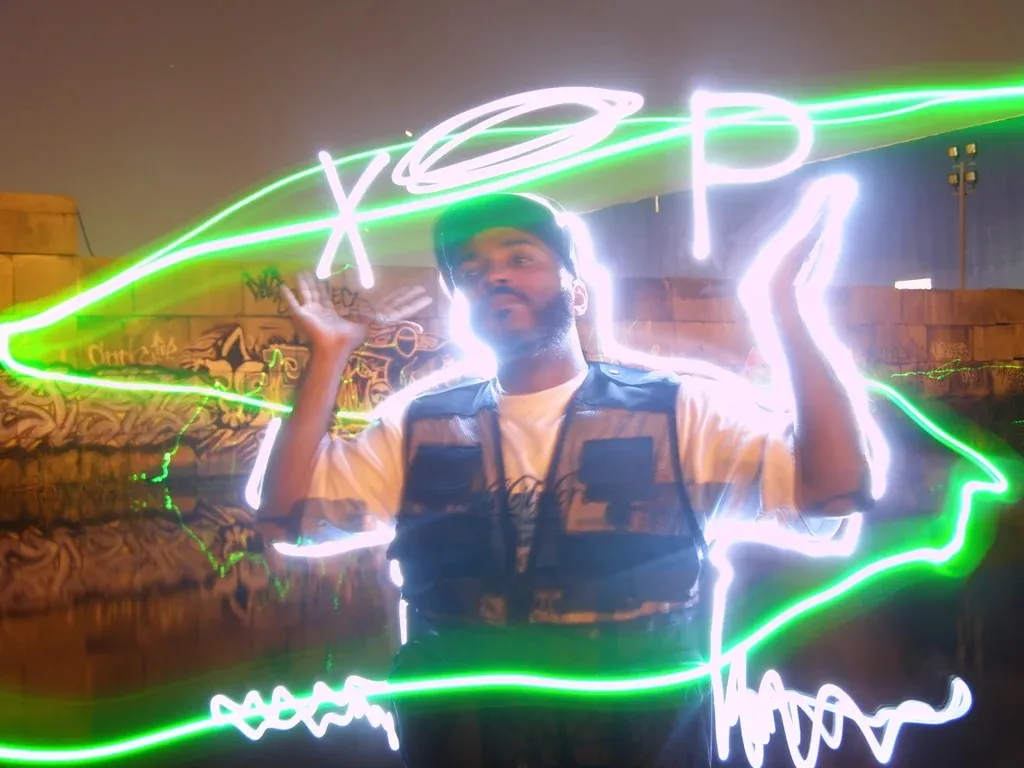
I was particularly interested in the discussion of bullet time last week — such a surreal way to traverse a moment.
On an individual basis, executing the effect itself is now in reach of DIYers. The rig used to shoot the following was built by the Graffiti Research Lab for $8000 in 2008.
The end-point for the glut of earth-centric images and data on the web seems to be a whole-earth snapshot, representing both the present moment any and desired point in (digitally sentient) history. Could we build a navigable world-wide instant if we had enough photos? Could the process be automated? Things like Street View certainly generate an abundance of photographs, but they’re all displaced in time.
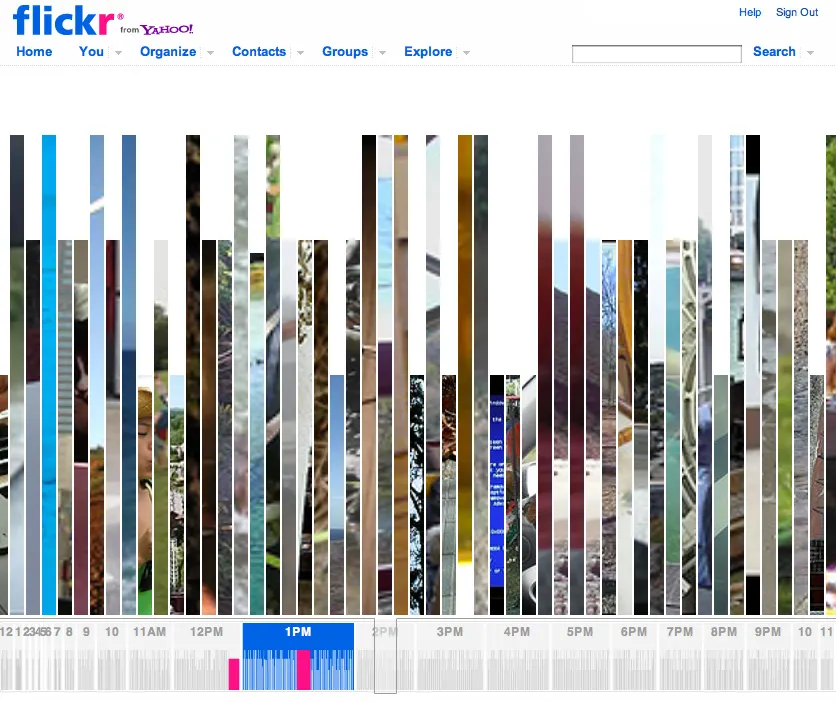
I searched pretty thoroughly and was surprised by how few efforts have been made to synchronize photographs in time (though plenty of effort has been made on the geographic space front.) Flickr has put together a clock of sorts. It’s interesting, but it only spans a day’s time and doesn’t layer multiple images on a current moment.
Still, Flickr’s a great source for huge volumes of photos all taken at the same instant. (Another 5,728 posted in the last minute.)
I wanted to see if the beginnings of this world-scale bullet-time snapshot could be constructed using publicly available tools, so I set out to write a little app via the Flickr API to grab all of the photos taken at a particular second. With this, it’s conceivable (though not yet true in practice) that we could build a global bullet-time view (of sorts) of any moment.
I ran into some grief with the Flickr API, it doesn’t seem to allow second-level search granularity, although seconds data is definitely in their databases. So as an alternative I went for uploaded date, where seconds data is available through the API (at least for the most recent items.)
2022 Update:
Upon revisiting the source code, it’s now possible to find matching photo capture times instead of just using the upload times. The latest version of the algorithm identifies collisions if:
The capture times match down to the second.
The photo’s owner is different from those already in the collision collection (to keep the results interesting).
The photos’ capture time and upload time don’t match (based on minutes and seconds matching, to deal with the lack of time zone > consistency between these fields).
The captures times have a high confidence value according to Flickr’s data.
Kudos to Flickr for keeping their API working with almost no breaking changes for more than a decade.
This could be taken even further if the search was narrowed to those images with geotag metadata. With enough of that data, you could construct a worldwide snapshot of any given second with spatial mapping, bringing us closer still to the whole-earth snapshot.
Some efforts have been made to represent the real time flow of data, but they generally map very few items to the current moment, and don’t allow navigation to past moments. For example:
Update: Here’s the reason Flickr’s API refused to give me all the photos within the bounds of a second:
“A tag, for instance, is considered a limiting agent as are user defined min_date_taken and min_date_upload parameters — If no limiting factor is passed we return only photos added in the last 12 hours (though we may extend the limit in the future).”
The current theory is that the an orange bag snagged on the camera array. This would also explain the blurred, unusually large text overlaying the view. Maybe the StreetView-blocking British villagers could deploy a barrage of wind-born privacy prophylactics in their next campaign.
Pick a piece of interactive technology in public, used by multiple people. Write down your assumptions as to how it’s used, and describe the context in which it’s being used. Watch people use it, preferably without them knowing they’re being observed. Take notes on how they use it, what they do differently, what appear to be the difficulties, what appear to be the easiest parts. Record what takes the longest, what takes the least amount of time, and how long the whole transaction takes. Consider how the readings from Norman and Crawford reflect on what you see.