Frontier Nerds: An ITP Blog

Buzz Pot: A Variable Detent Potentiometer

In the course of developing Brain Radio with Arturo and Sofy, we saw the need for a means of tuning between an arbitrary, and potentially unstable number of channels. For the sake of context, Brain Radio is a head-mounted EEG-based broadcast system — everyone with a headset can tune into anyone else with a headset, and listen to sounds synthesized by that person’s brain waves.

How, exactly, would the tuning process take place? We knew a few things:

  • We wanted to use a dial to leverage associations with radio / tuning / broadcast / analog.
  • We would need some kind of tactile feedback, since the dial would be mounted on the headset, outside of the wearer’s field of view.
  • The number of available stations / channels would vary — if three people were in range, the dial would need to be able to tune to three positions. If more channels came online or dropped out, the interface would have to adapt.

What we really wanted was a potentiometer with detents, to make it easy to click-click-click from station to station. Detents also summon a tactile delight rivaled only by toggle switches and large mechanical levers. They inflate the sense of intention associated with an action: They make you feel like you know what you’re doing.

The catch, of course, is that potentiometers with detents have a finite number of them, and they’re set at the factory. If we bought five-detent pots and ended up with six radio channels to tune between, we were SOL. What we needed was a variable detent potentiometer.

Google turned up some shady, product-less patent filings. And the PComp list confirmed that no such device existed — and then suggested something very savvy: use something else to generate the tactile feedback.

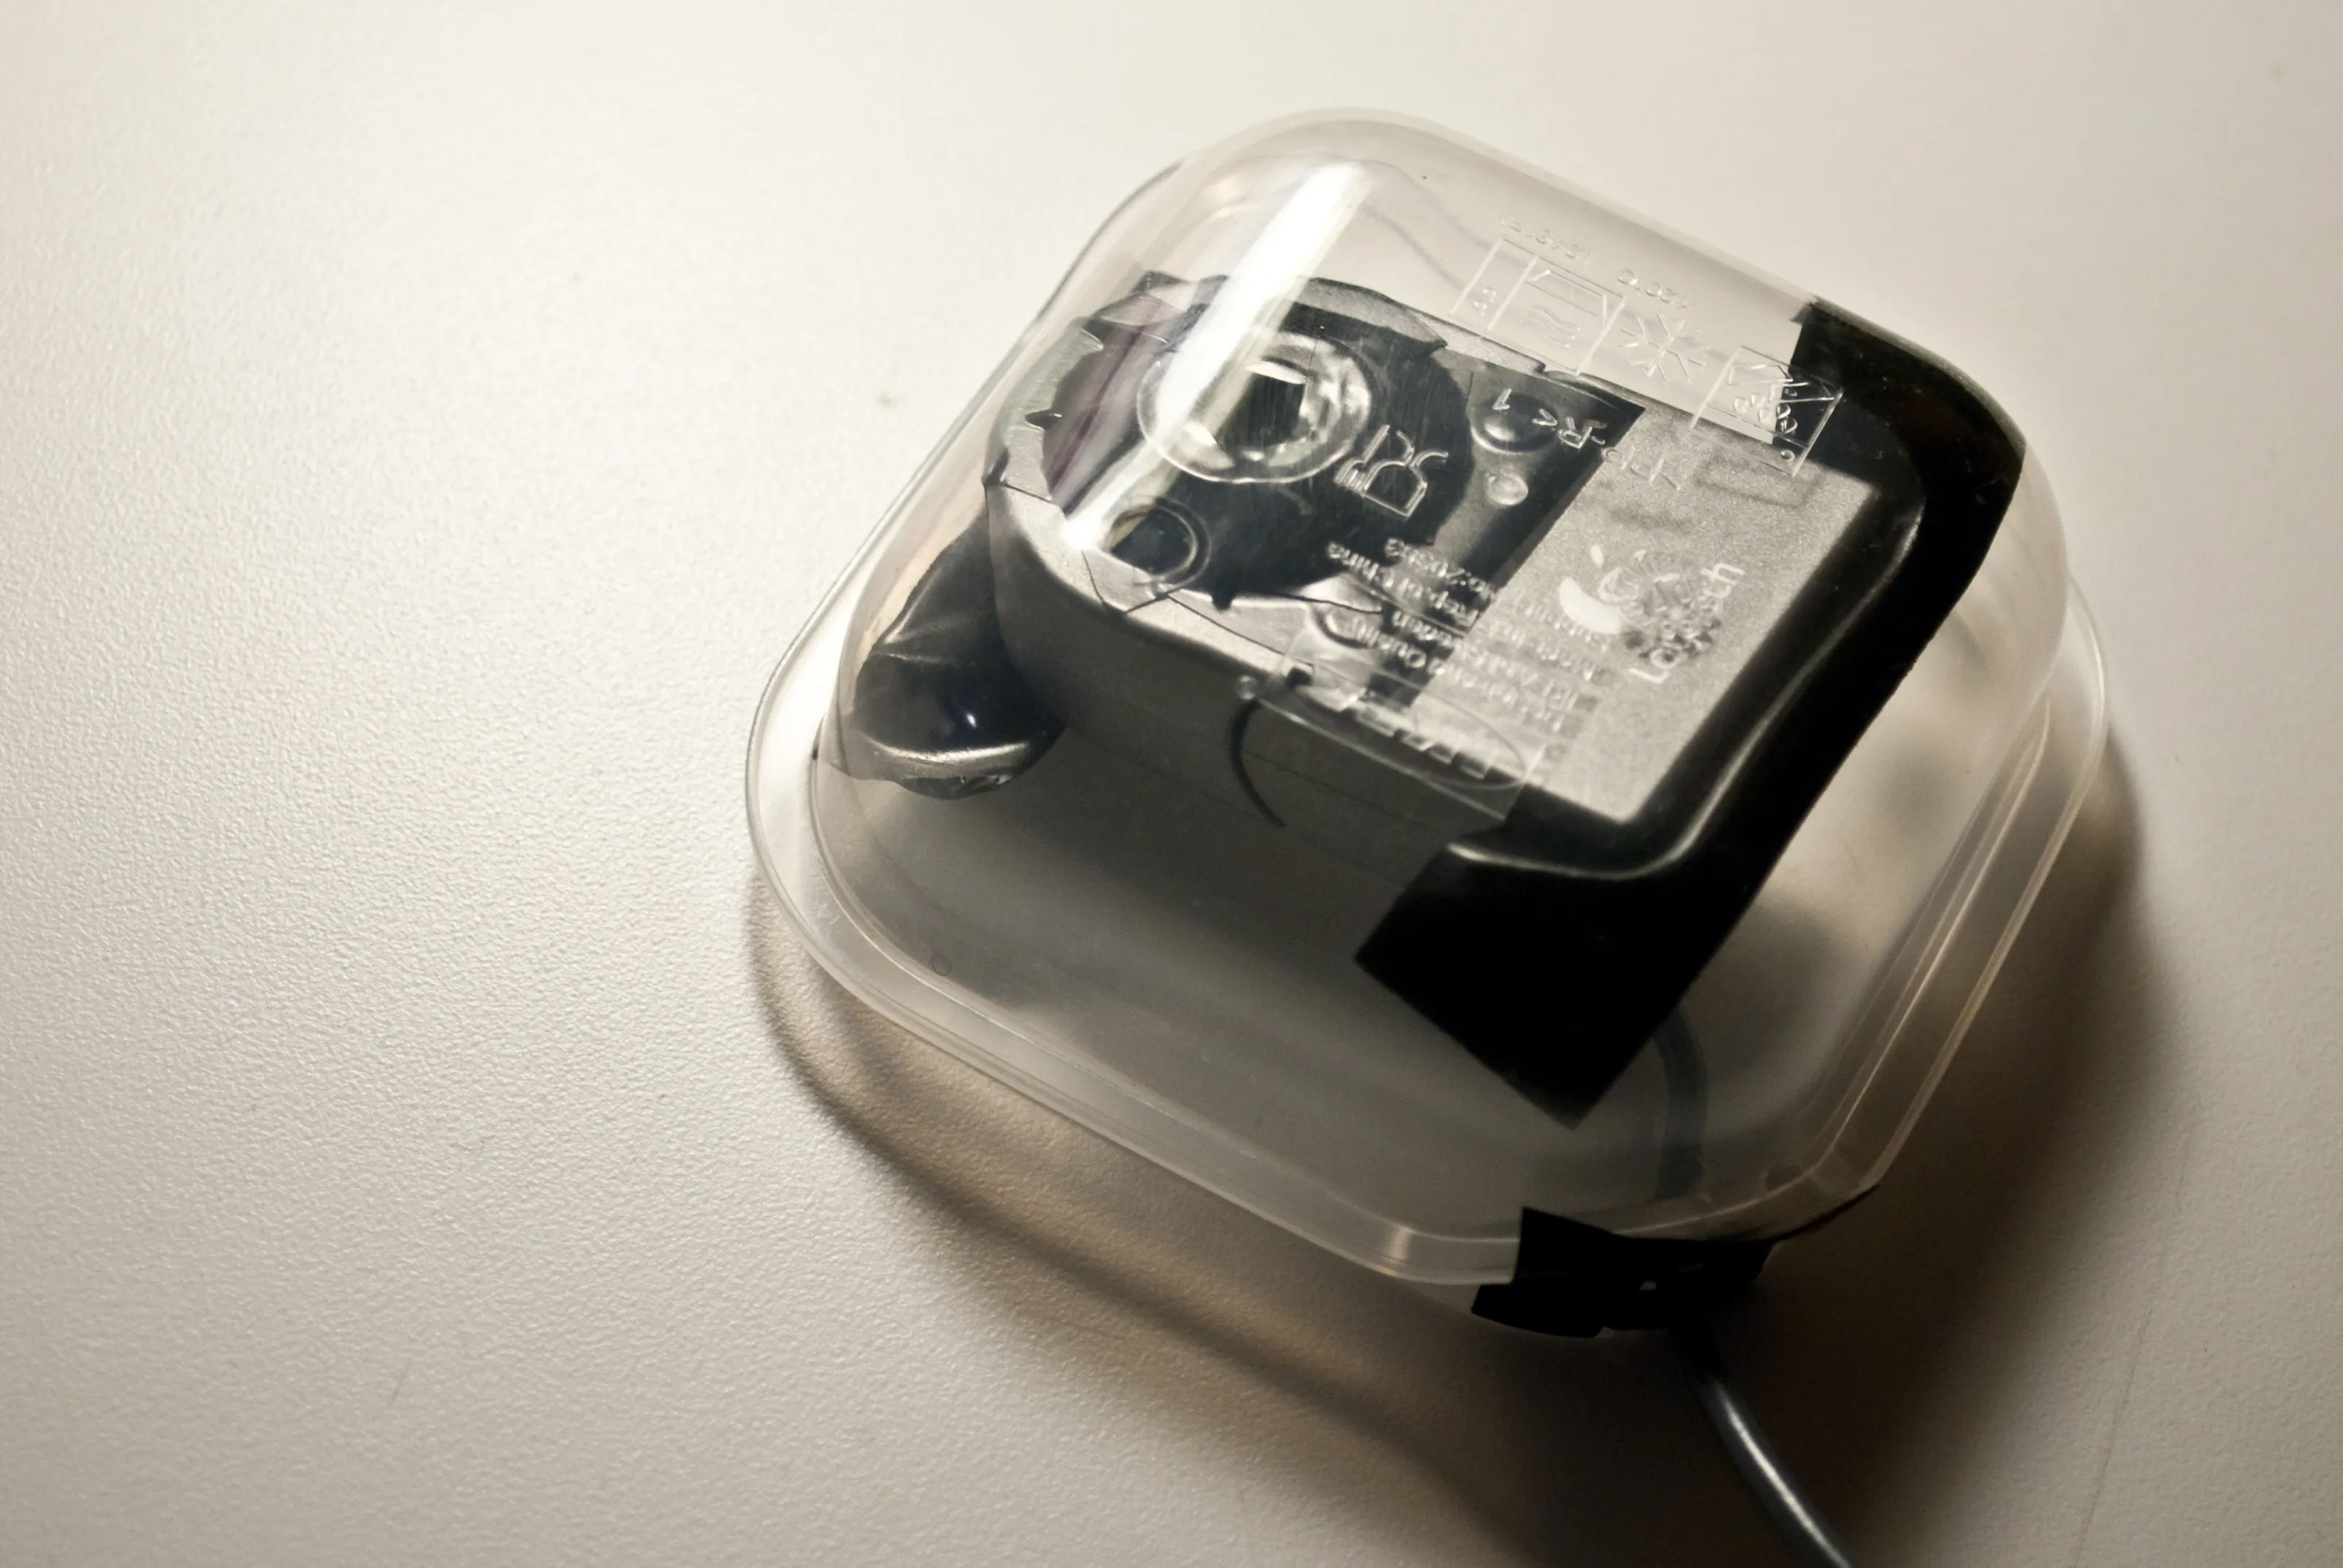
How about a vibration motor…

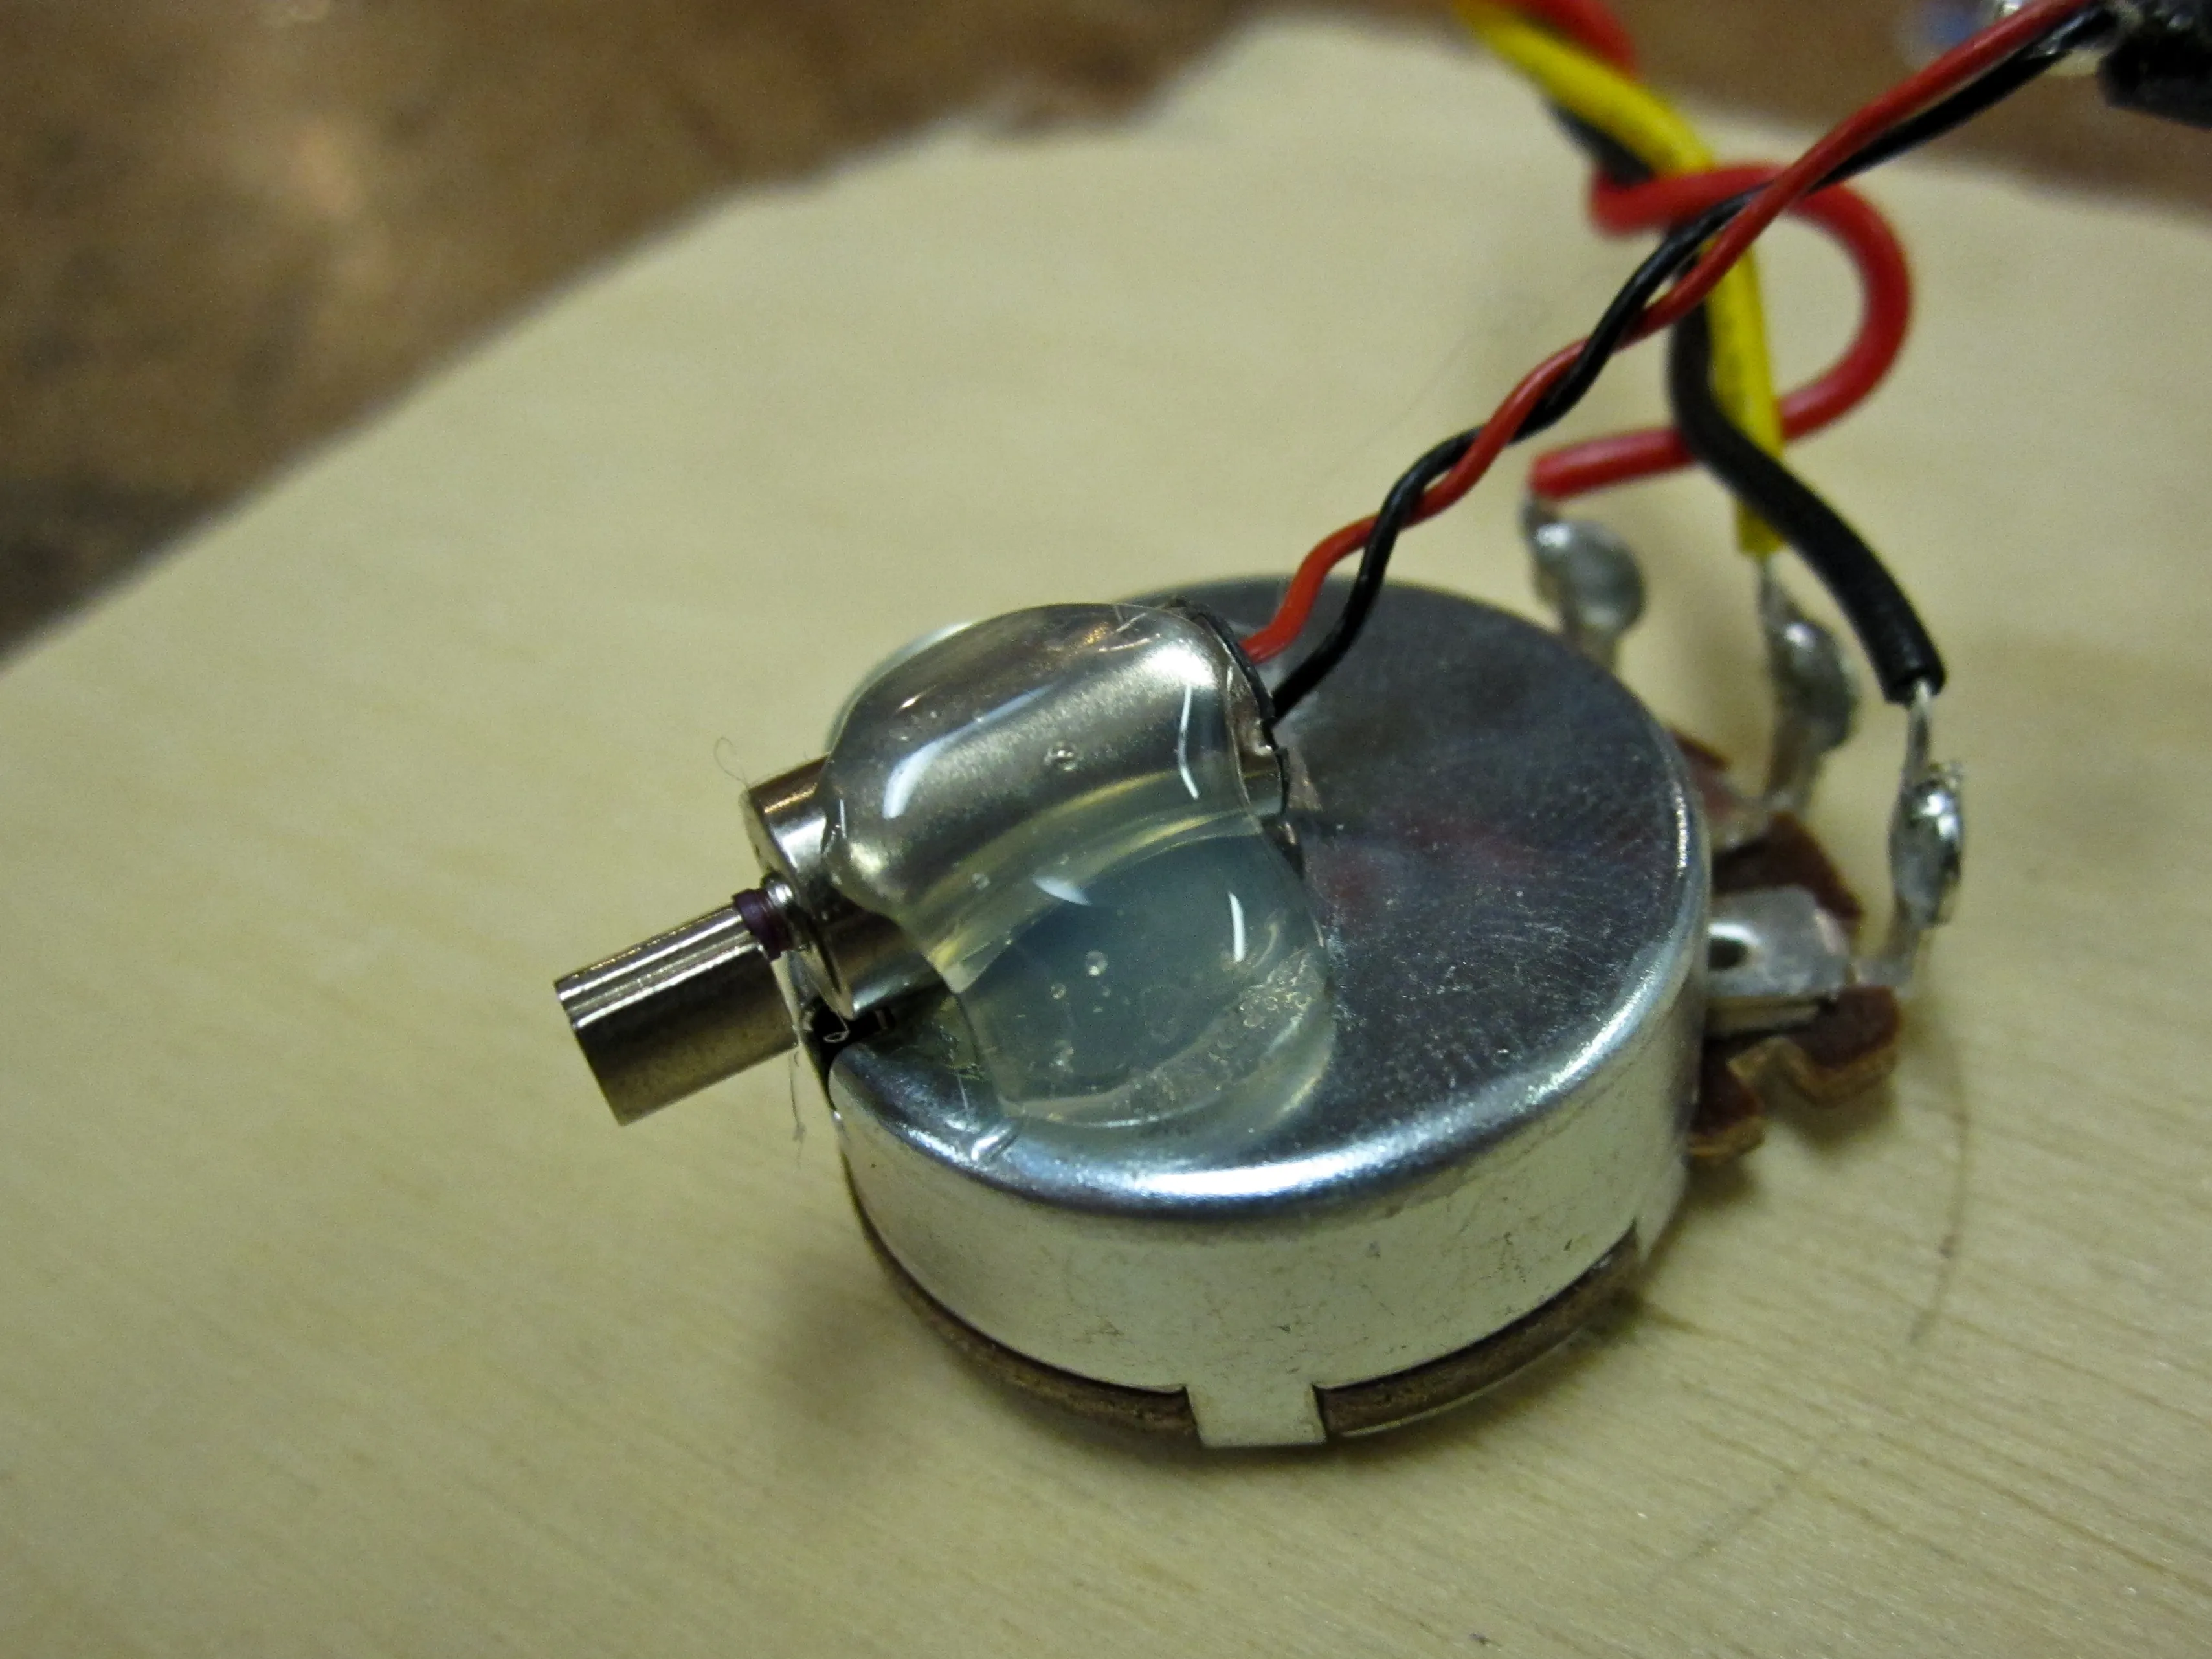
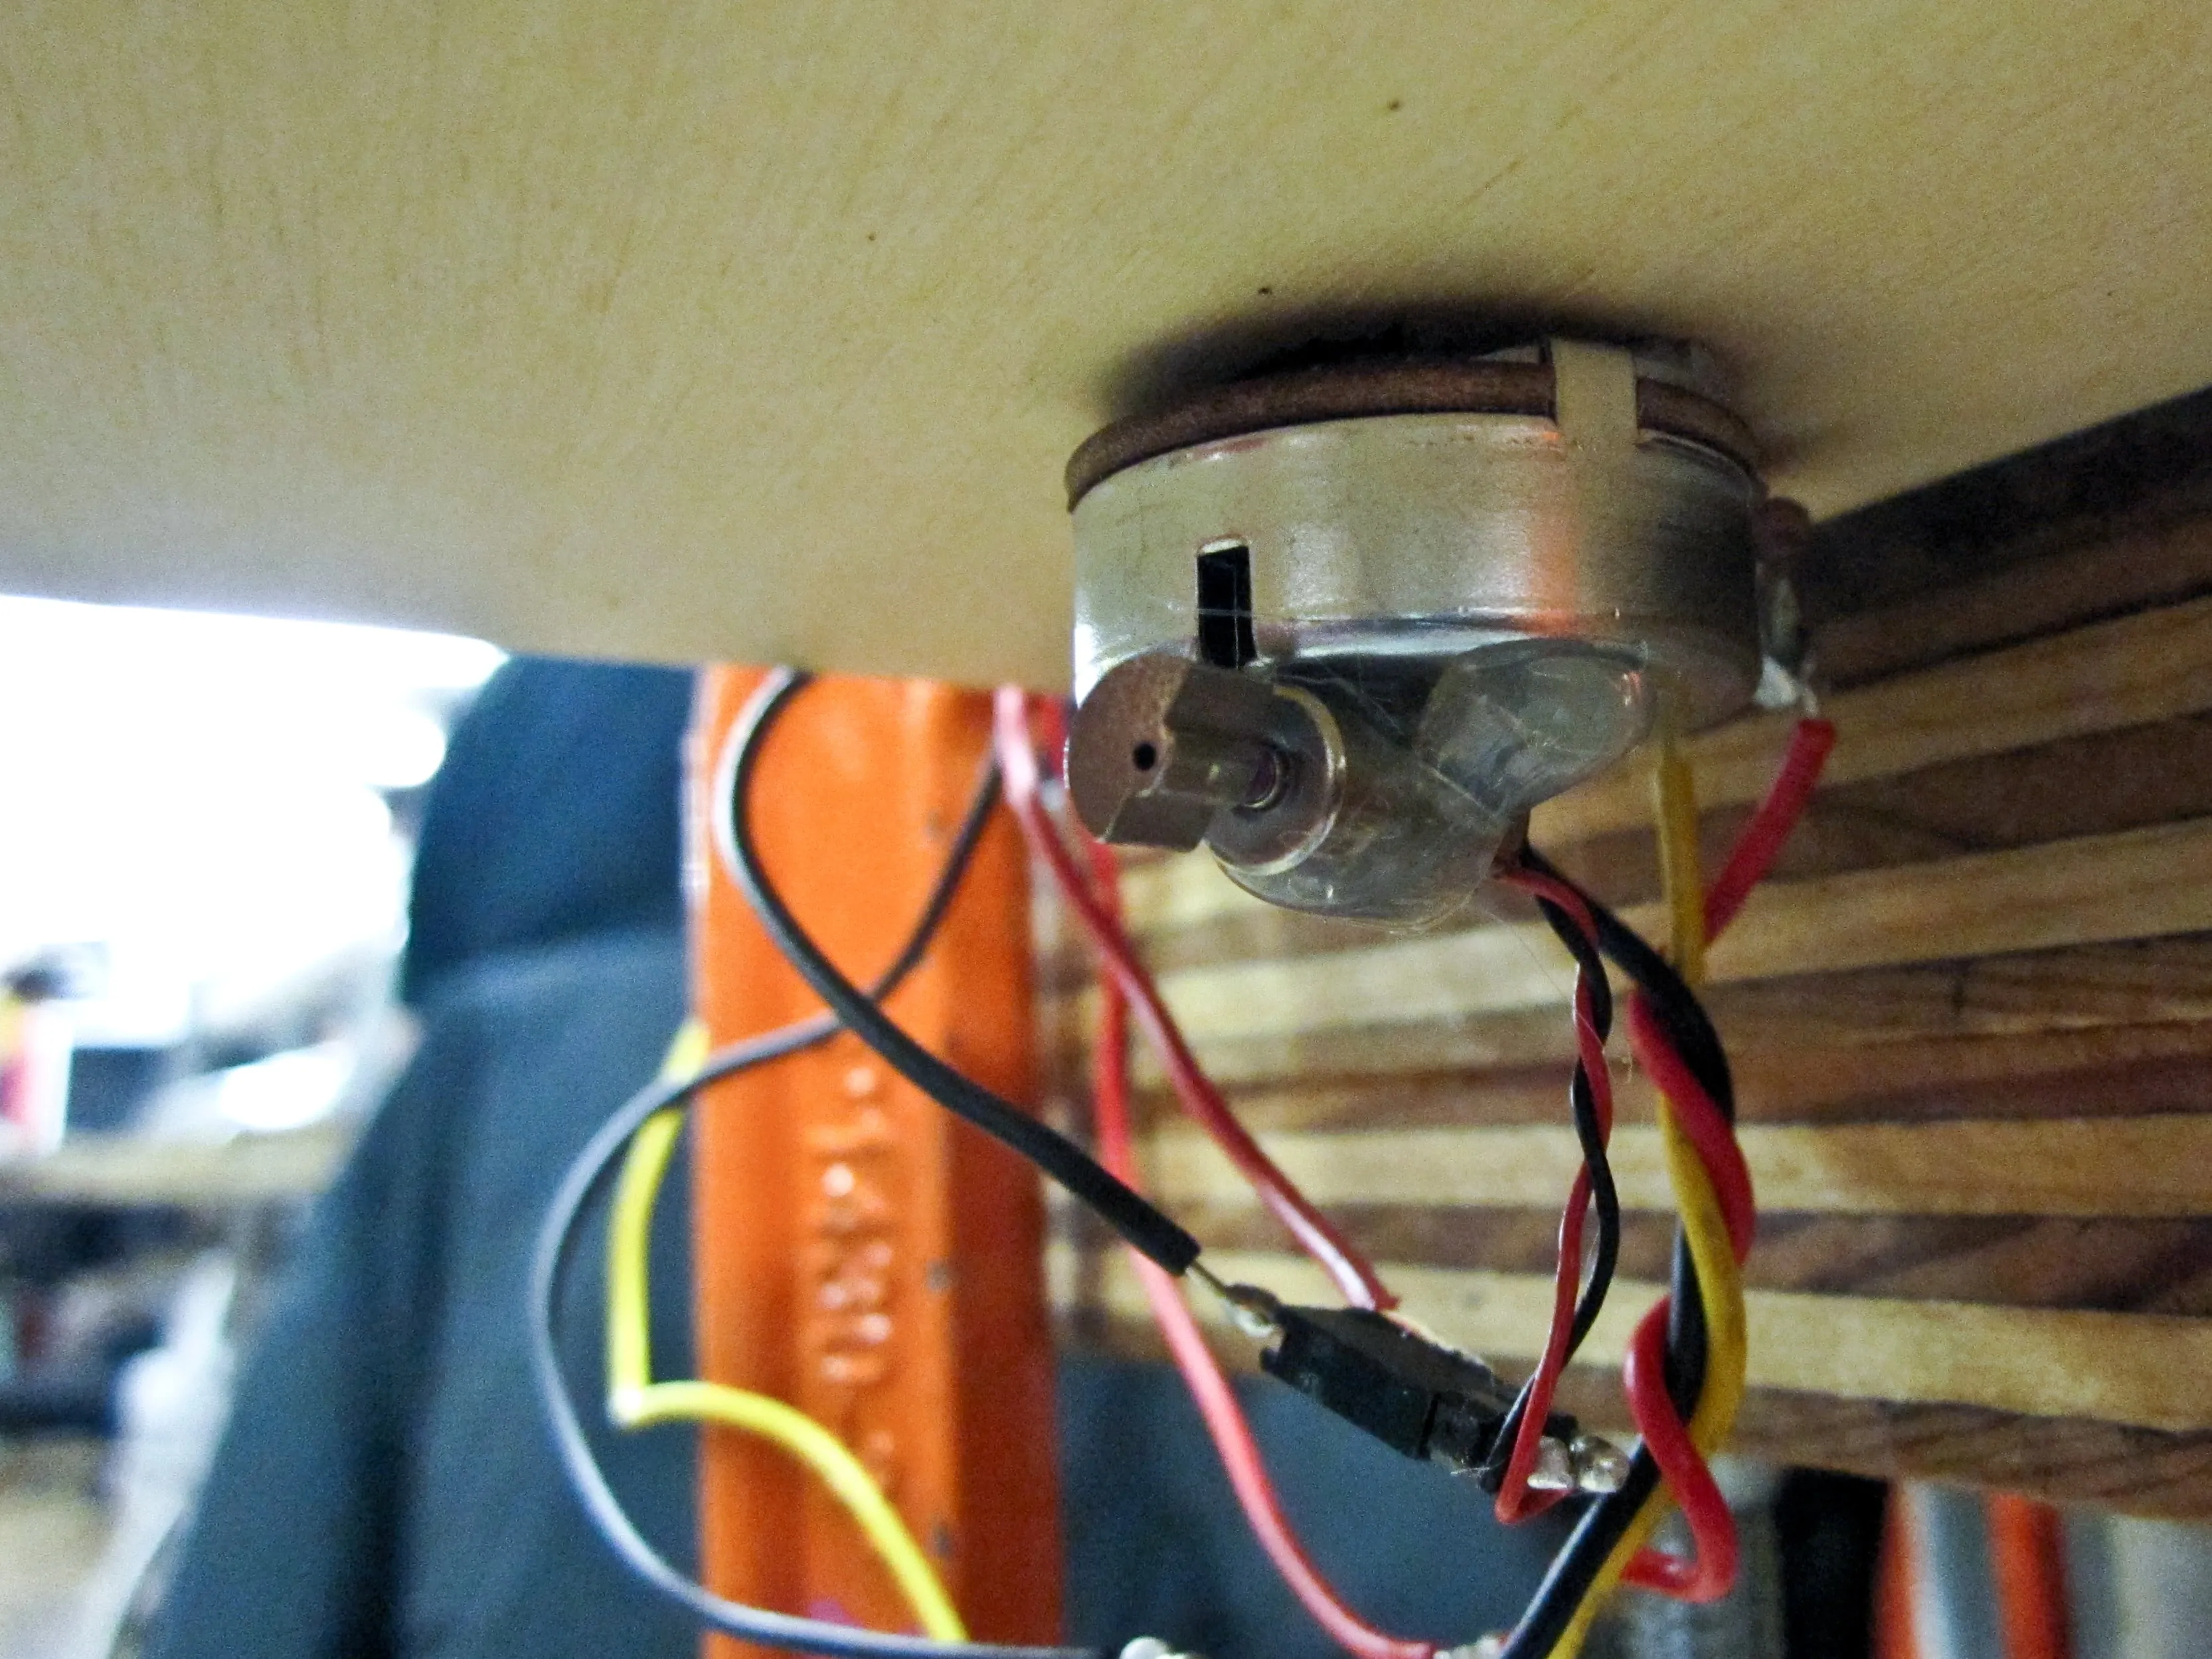
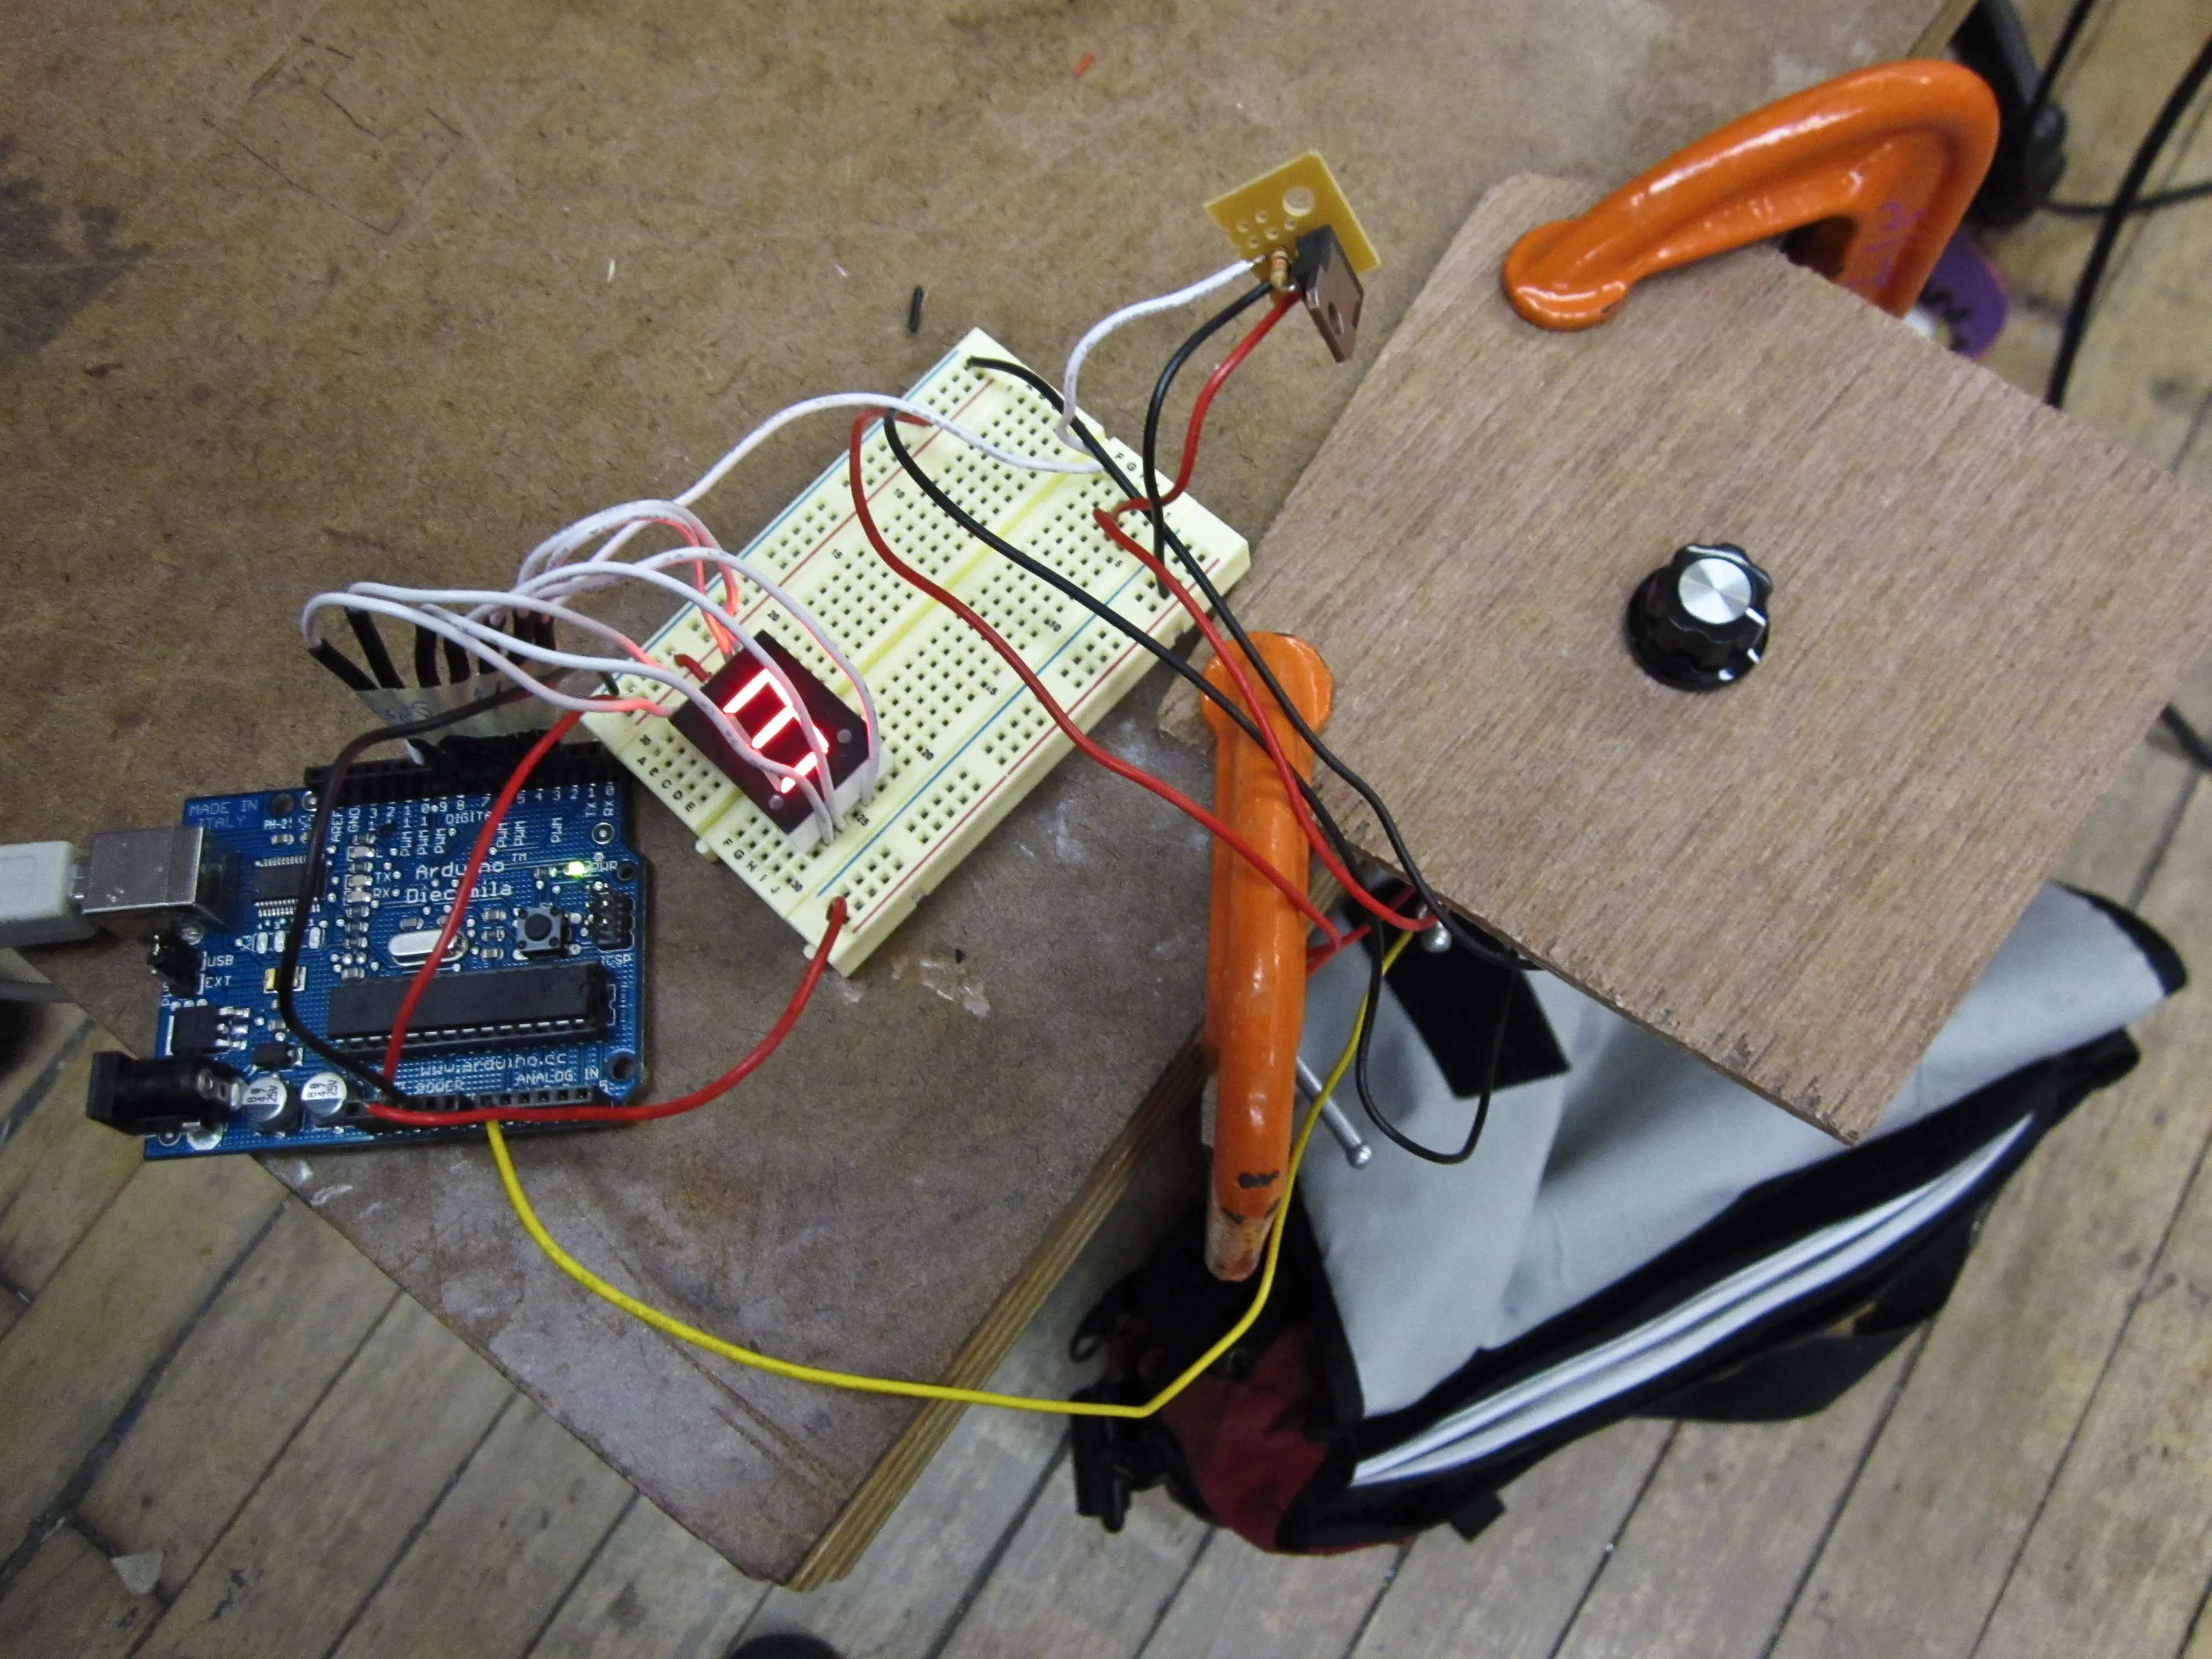
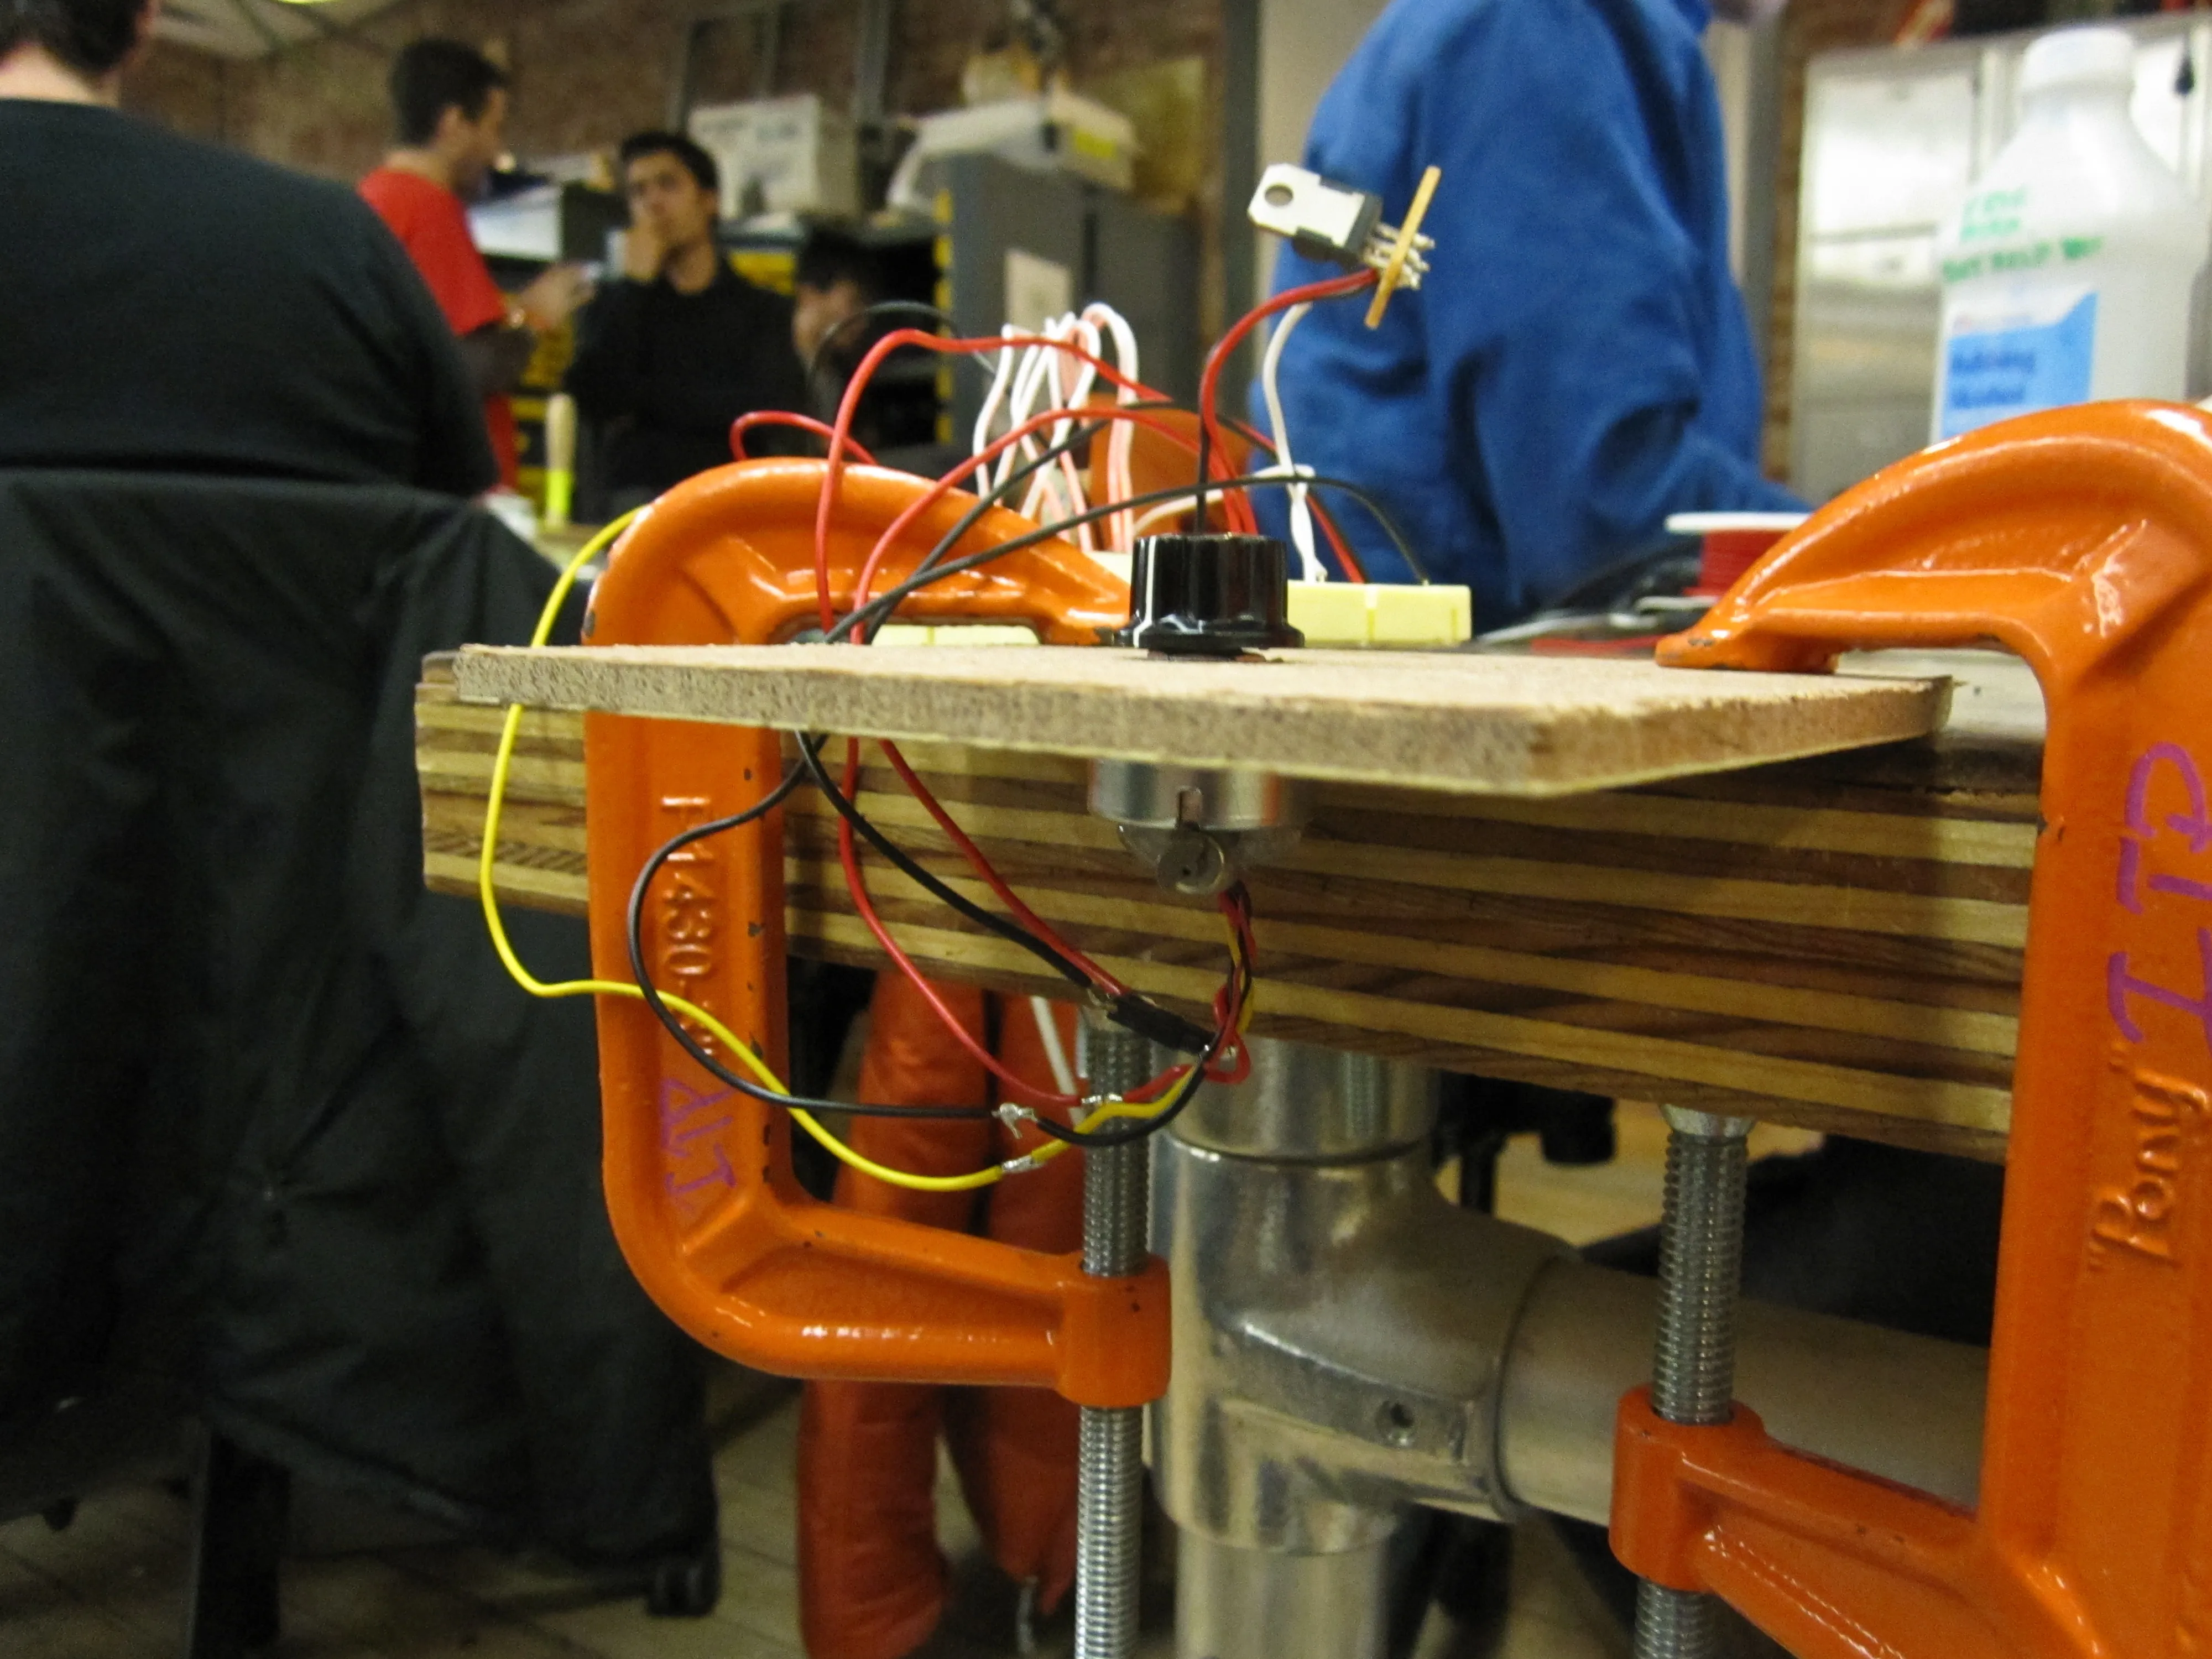
So I did exactly that. A vibration motor, some hot glue, a potentiometer, and some code all collided to create the buzz pot:

The video doesn’t really communicate the physical feedback coming through the pot when channel thresholds are crossed, but in practice it works pretty well. The number of channels is easily changed in software — and the resistance range of the potentiometer is simply divided up so a given range of values represent a single channel.

For example, a three channel setting would put channel 1 between analog values 0 and 341, channel 2 between 341 and 682, and then channel 3 between 682 and 1023. When the pot passes from one channel range to the next, the microcontroller flips on the transistor controlling power to the vibration motor for a fraction of a second, sending a mechanical buzz through the pot that lets the user feel when they’ve changed channels, even if they can’t see what they’re doing.

Development was relatively simple. Hot glue held up surprisingly well to the vibration motor.

Buzz pot motor mounted Buzz pot bottom view

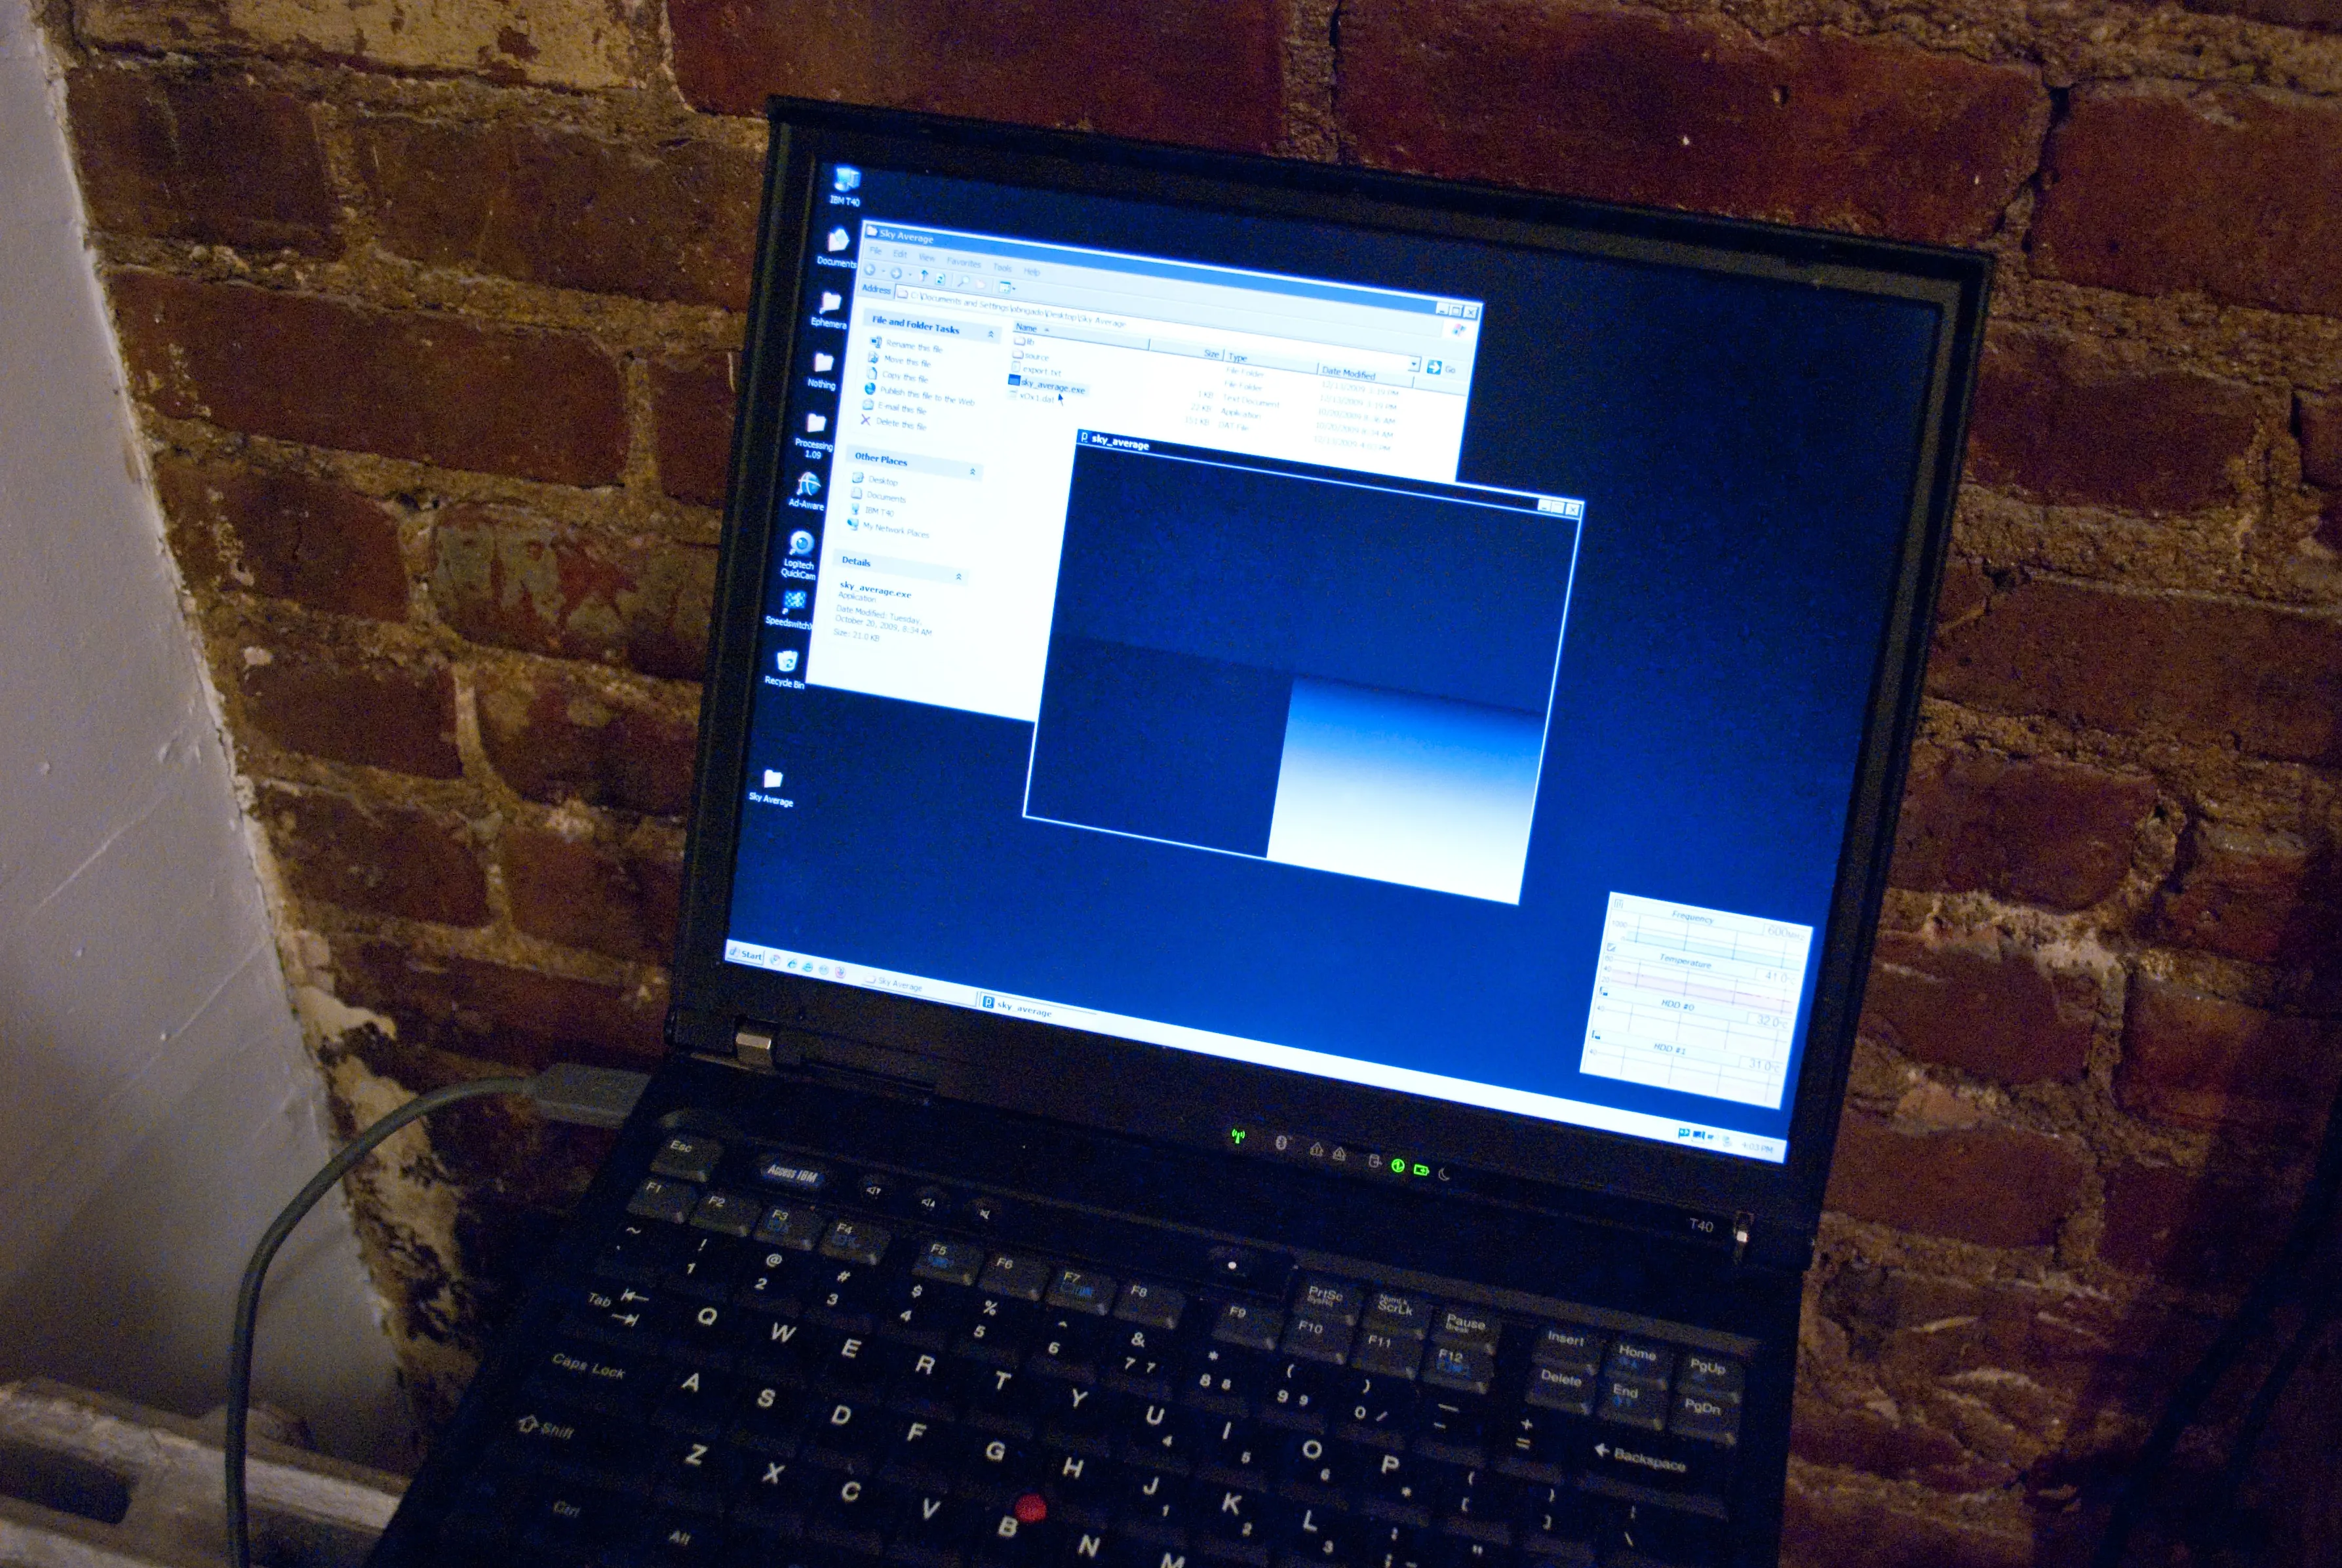
The basic test configuration includes a seven-segment LED display so I could verify when the channels changed.

Buzz pot test configuration Buzz pot clamped to a table for testing

Here’s the schematic. The seven-segment display adds some complexity… it’s really just for troubleshooting purposes (sending the channel status out over serial would be much simpler). Even then, a shift-register would allow for more sensible use of the Arduino’s pins if this were more than a proof of concept. The TIP 120 between the Arduino and the vibration motor is definitely overkill, I just put it in place since Brain Radio was going to have discrete power sources and it would have made sense to put the motor on the non-Arduino power supply. (Some of the graphics in the schematic were adapted from the Fritzing project.)

Buzz Pot Schematic

And finally, the code:

// Buzz Pot
// Eric Mika, 2009
// Provides tactile feedback for a potentiometer to denote changes
// from one value range to another. Ideal for situations where an unknown
// number of values must be set by a single potentiometer.
// To do:
// 1. Debounce the thresholds.
// 2. Handle fringe-case runtime channel count changes.

int vibrationPin = 9; // Turns the vibration motor on and off through a transistor.
int potPin = 0; // Reads the potentiometer.
int potValue = 0; // Stores the potentiometer value.

int channels = 10; // Number of values selectable by the pot.
int currentChannel = 0; // Starting value.
int lastChannel = 0;

int vibDuration = 200; // How long to turn the motor on when thresholds are crossed.
unsigned long vibStart = 0; // Keep track of time so we know when to turn off the motor.

// Map digital pins to their respective LEDs in the 7 segment display.
// Could use a shift register instead to save pins.
int dispA = 2;
int dispB = 3;
int dispC = 4;
int dispD = 5;
int dispE = 6;
int dispF = 7;
int dispG = 8;

void setup() {
  // Set up 7 segment display pins.
  pinMode(dispA, OUTPUT);
  pinMode(dispB, OUTPUT);
  pinMode(dispC, OUTPUT);
  pinMode(dispD, OUTPUT);
  pinMode(dispE, OUTPUT);
  pinMode(dispF, OUTPUT);
  pinMode(dispG, OUTPUT);

  // Set up vibration pin.
  pinMode(vibrationPin, OUTPUT);
}

void loop() {
  // Read the analog input into a variable, correct for value inversion.
  potValue = 1023 - analogRead(potPin);

  // If 10 channels, return a number between 0 and 9...
  // Constrain to catch rounding errors at the top end.
  currentChannel = constrain(potValue / (1023 / channels), 0, channels - 1);

  // Show the current channel number on the 7 segment display.
  displayDigit(currentChannel);

  // Vibrate if we change channels.
  if (lastChannel != currentChannel) {
    vibStart = millis();
  }

  // Keep vibrating for the full duration...
  if ((millis() - vibStart) <= vibDuration) {
    digitalWrite(vibrationPin, HIGH);
  }
  else {
     digitalWrite(vibrationPin, LOW);
  }

  lastChannel = currentChannel;
}

// Shows a number on the 7 segment display.
// It's a common anode model, so LOW is actually on.
void displayDigit(int digit) {
  switch (digit) {
  case 0:
    digitalWrite(dispA, LOW);
    digitalWrite(dispB, LOW);
    digitalWrite(dispC, LOW);
    digitalWrite(dispD, LOW);
    digitalWrite(dispE, LOW);
    digitalWrite(dispF, LOW);
    digitalWrite(dispG, HIGH);
    break;
  case 1:
    digitalWrite(dispA, HIGH);
    digitalWrite(dispB, LOW);
    digitalWrite(dispC, LOW);
    digitalWrite(dispD, HIGH);
    digitalWrite(dispE, HIGH);
    digitalWrite(dispF, HIGH);
    digitalWrite(dispG, HIGH);
    break;
  case 2:
    digitalWrite(dispA, LOW);
    digitalWrite(dispB, LOW);
    digitalWrite(dispC, HIGH);
    digitalWrite(dispD, LOW);
    digitalWrite(dispE, LOW);
    digitalWrite(dispF, HIGH);
    digitalWrite(dispG, LOW);
    break;
  case 3:
    digitalWrite(dispA, LOW);
    digitalWrite(dispB, LOW);
    digitalWrite(dispC, LOW);
    digitalWrite(dispD, LOW);
    digitalWrite(dispE, HIGH);
    digitalWrite(dispF, HIGH);
    digitalWrite(dispG, LOW);
    break;
  case 4:
    digitalWrite(dispA, HIGH);
    digitalWrite(dispB, LOW);
    digitalWrite(dispC, LOW);
    digitalWrite(dispD, HIGH);
    digitalWrite(dispE, HIGH);
    digitalWrite(dispF, LOW);
    digitalWrite(dispG, LOW);
    break;
  case 5:
    digitalWrite(dispA, LOW);
    digitalWrite(dispB, HIGH);
    digitalWrite(dispC, LOW);
    digitalWrite(dispD, LOW);
    digitalWrite(dispE, HIGH);
    digitalWrite(dispF, LOW);
    digitalWrite(dispG, LOW);
    break;
  case 6:
    digitalWrite(dispA, LOW);
    digitalWrite(dispB, HIGH);
    digitalWrite(dispC, LOW);
    digitalWrite(dispD, LOW);
    digitalWrite(dispE, LOW);
    digitalWrite(dispF, LOW);
    digitalWrite(dispG, LOW);
    break;
  case 7:
    digitalWrite(dispA, LOW);
    digitalWrite(dispB, LOW);
    digitalWrite(dispC, LOW);
    digitalWrite(dispD, HIGH);
    digitalWrite(dispE, HIGH);
    digitalWrite(dispF, HIGH);
    digitalWrite(dispG, HIGH);
    break;
  case 8:
    digitalWrite(dispA, LOW);
    digitalWrite(dispB, LOW);
    digitalWrite(dispC, LOW);
    digitalWrite(dispD, LOW);
    digitalWrite(dispE, LOW);
    digitalWrite(dispF, LOW);
    digitalWrite(dispG, LOW);
    break;
  case 9:
    digitalWrite(dispA, LOW);
    digitalWrite(dispB, LOW);
    digitalWrite(dispC, LOW);
    digitalWrite(dispD, LOW);
    digitalWrite(dispE, HIGH);
    digitalWrite(dispF, LOW);
    digitalWrite(dispG, LOW);
    break;
  default:
    digitalWrite(dispA, HIGH);
    digitalWrite(dispB, HIGH);
    digitalWrite(dispC, HIGH);
    digitalWrite(dispD, HIGH);
    digitalWrite(dispE, HIGH);
    digitalWrite(dispF, HIGH);
    digitalWrite(dispG, HIGH);
  }
}

It's Video Art

André Callot’s pithy survey of video art. Via Ben Kolak.

Real-time Sky

For the com lab final, I decided to revisit the blog-improvement assignment — might have been low hanging fruit given my prior experience on these fronts, but I wanted to try something new: tapping real-time sensor data to determine the aesthetic properties of my website.

I spend such an inordinate amount of time in front of screens, that bringing in a bit of the outside world onto said screens seemed like a nice thing to do (if just a bit sad).

So I decided to set up a camera pointed at the sky, 24 / 7, and use the average sky color to set the background on this website.

First, I needed a camera. I scrounged up an old webcam, and put it in a small Tupperware container since it was going to have to brave the elements on my windowsill.

Camera in Tupperware enclosure Camera in Tupperware enclosure with lid

Next up was how to get data from the camera to the web. I just found out about a website called Pachube (confoundingly pronounced “patch bay”) which provides a platform for the hosting and exchange of small bits of sensor data — ideal for this application. So I set up an input feed on Pachube to receive and store the sky color values.

I whipped up a Processing application to read from an old webcam, average the pixel values, and then send the value up to Pachube every minute. (The EEML Library for Processing made interfacing with Pachube completely painless.)

Getting the data out of Pachube and into my Drupal Blog needed another piece of glue code: the Pachube PHP Library. I created a Drupal module to wrap up the library, and another small module to query their servers, grab the current color value, pass it on to a bit of JavaScript, which then set the background color via jQuery.

Right now the background only updates on refresh (since the data changes quite slowly) but it wouldn’t be much more work to set up a timer and some AJAX to fetch the latest value at a regular interval.

With the software working…

Sky camera monitoring software

And the camera situated…

Sky camera in windowsill

I was ready for the data to start coming in. My webcam had other ideas, though. It turns out that even with auto-exposure and auto-gain turned on, the sensor doesn’t have enough dynamic range to capture the sky with any kind of accuracy. The sky is just too bright during the day, and too dark at night. There are a few interesting color values at dawn and dusk, but otherwise it’s either solid black or solid white.

Here’s a look at tonight’s sunset (the top of the gradient is about 6

PM ET, the bottom is 2
PM ET (the sun officially set at 4
). There’s about an hour of meaningful color data between the blown-out day and solid-black night. I’m investigating more sensitive camera options, in hopes of getting meaningful values for more of the day.

4 Hours of sky cam data


Here’s the Processing code. It’s a bit verbose, since I entertained a few what-if scenarios and drew out some portions for legibility’s sake. The low frame rate helps keep CPU usage (and therefore CPU temperature and fan noise) within the realm of rationality.

// Sky color logger.

// Takes a photograph of the sky every second, then finds and stores the average color value.
// Each minute, average the one-second averages to find the average sky color over the last minute.
// Upload the result to Pachube (http://www.pachube.com/) as a hexadecimal color value.
// Built with the EEML Library for Processing, available at http://www.eeml.org/library/
import processing.video.*;
import eeml.*;

DataOut dataOut;
Capture cam;

int pixelCount;
color averageColor;
color minuteAverageColor;
int lastMinute;

int minuteAverageRed = 0;
int minuteAverageGreen = 0;
int minuteAverageBlue = 0;
int averageRed = 0;
int averageGreen = 0;
int averageBlue = 0;
int sampleCount = 0;

int[] averages; // Stores recent averages.

void setup() {
 size(640, 480);
 noStroke();
 frameRate(2);

 // Set up communication with Pachube.
 String feedURL = "http://www.pachube.com/api/feeds/3929.xml";
 String apiKey = "YOUR PACHUBE API KEY HERE";
 dataOut = new DataOut(this, feedURL, apiKey);
 dataOut.addData(0, "sky,color");

 // Set up the camera.
 String[] devices = Capture.list();
 println(devices);
 cam = new Capture(this, 320, 240, devices[1]);
 cam.frameRate(1); // Read 1 frame per second.
 pixelCount = cam.width * cam.height;

 // Take note of the time. We will upload once per minute.
 lastMinute = minute();

 // Store recent averages in an array.
 averages = new int[240];

 // Fill the averages array with white to start
 for(int i = 0; i < averages.length; i++) averages[i] = 255;
}

void draw() {
 background(0);

 // Show the live camera feed in the top left.
 fill(0);
 image(cam, 0, 0);

 // Show the latest average color in the top right.
 fill(averageColor);
 rect(320, 0, 320, 240);

 // Show the last minute average in the bottom left.
 // This is what was actually sent to Pachube.
 fill(minuteAverageColor);
 rect(0, 240, 320, 240);

 // Draw the recent averages as horizontal lines in the bottom right.
 // The latest values are pushed onto the top of the stack.
 for(int i = 0; i < averages.length; i++) {
   stroke(averages[i]);
   strokeWeight(1);
   line(320, 240 + i, 640, 240 + i);
 }
 noStroke();

 // Aggregate the averages and send to Pachube every minute.
 if((minute() != lastMinute) && (sampleCount > 0)) {

   // Find the aggregated average for each minute.
   minuteAverageRed = minuteAverageRed / sampleCount;
   minuteAverageGreen = minuteAverageGreen / sampleCount;
   minuteAverageBlue = minuteAverageBlue / sampleCount;

   minuteAverageColor = color(minuteAverageRed, minuteAverageGreen, minuteAverageBlue);

   // Convert to hex and send to Pachube.
   println("Sending sky value " + hex(minuteAverageColor, 6) + " to Pachube.");
   dataOut.update(0, hex(minuteAverageColor, 6));
   int response = dataOut.updatePachube();
   println("Pachube response: " + response); // Should be 200 if successful; 401 if unauthorized; 404 if feed doesn't exist.

   // Shift values in the averages array over one, and then add the latest to the beginning.
   for(int i = averages.length - 1; i > 0; i--) averages[i] = averages[i - 1];
   averages[0] = minuteAverageColor;

   // Reset the minute averages.
   minuteAverageRed = 0;
   minuteAverageGreen = 0;
   minuteAverageBlue = 0;

   // Reset the sample count.
   sampleCount = 0;

   // Reset the minute mark.
   lastMinute = minute();
 }
}

void captureEvent(Capture cam) {
 // Get the latest camera data.
 cam.read();
 cam.loadPixels();

 // Reset the averages for this frame.
 averageRed = 0;
 averageGreen = 0;
 averageBlue = 0;

 // Average the pixels.
 int pixelColor;

 for (int i = 0; i < pixelCount; i++) {
   pixelColor = cam.pixels[i];

   // Extract the RGB values.
   averageRed += (pixelColor >> 16) & 0xff;
   averageGreen += (pixelColor >> 8) & 0xff;
   averageBlue += pixelColor & 0xff;
 }

 // Take the average.
 averageRed = averageRed / pixelCount;
 averageGreen = averageGreen / pixelCount;
 averageBlue = averageBlue / pixelCount;

 // Note this average for the aggregated average taken at the minute mark.
 // It would be simpler not to store every single frame's average, and instead to average
 // a minute's worth of pixel data (e.g. average = averageChannel / (pixelCount * sampleCount))
 // but for the sake of the display it's useful to have average data from the latest frame as well.
 minuteAverageRed += averageRed;
 minuteAverageGreen += averageGreen;
 minuteAverageBlue += averageBlue;

 averageColor = color(averageRed, averageGreen, averageBlue);

 // Iterate the sample count... this is what we use to take the average
 // at the minute mark. With the camera at 1 FPS, it should always be 60, but
 // in case of timing issues it's worth keeping track.
 sampleCount++;
}

SimCity 2000 Sprite Extraction

In preparation for an AfterEffects project, I set out to free the SimCity 2000 building tiles from their binary confines. I wanted every building in the game on a transparent background. Here’s the final working set I ended up with:

Animated loop of the tile assets from SimCity 2000

Getting all of the assets in shape for AfterEffects turned out to be a bit of an ordeal. My initial plan was to do something clever, like writing a parser for the mysterious .mif file format in which Maxis embedded their tile data. A thorough Googling turned up no documentation or existing hacks for the file type. Poking through the bytes with my trusty hex editor also failed to bring enlightenment. Since MIF is ostensibly a graphics format, in a final act of desperation I attempted to interpret the bytes as pixels via Photoshop, again with no success. It’s not even an autostereogram:

Failed processing of SimCity 2000 MIF tile set file

(This dead-end detour did bring to mind the need for a tool that can take the friction out of rapidly reinterpreting large binary files as pixel data… being able to “tune” the dimensions / header length / byte order of the image parser in real-time whilst looking for the emergence of some kind of pattern or representational content in the pixels could be useful, or at least of conceptual interest. I’ll add it to the project queue.)

In the end I resorted to a mandraulic approach: selecting each building in the Urban Renewal Kit, exporting a BMP for each, and sending the results through a number of Photoshop batches to place them on transparency, resize, etc.

Not exactly clever, but it worked.


Update: More recently, reverse engineering has yielded insights into the .mif file format and other facets of the original SimCity 2000 implementation.

Real Time Omniscience

Our survey of live video services last week proved that there’s plenty of content out there, but the bottleneck seemed to be a lack of discoverability in the interface. None of the sites we looked at really gave the sense of how much was happening at one, or provided a way to sift through the piles of live video to find something of relevance or interest. The major live webcam sites seem stuck in the YouTube / catalog approach. Luckily for us, JustinTV hosts an API that makes building experimental interfaces relatively painless.

(Ustream offers a similar but slightly less robust API.)

I wanted to see whether bandwidth / API terms-of-service / human perception would allow for a massive grid of live feeds. The answer turns out to be “sort of.” I wrote some code to take the most active JustinTV channels in the “lifecasting” category, and dump them into a grid.

The results are available here.

In case the system breaks, or I run through my API allocation, a video of the system in action is available below:

A few other re-workings of the catalog approach are of interest.

5000 Webcams places live feeds in geographical context on a google map. (Also available as a grid view.)

Map of the United States with locations of public live webcam feeds pinned