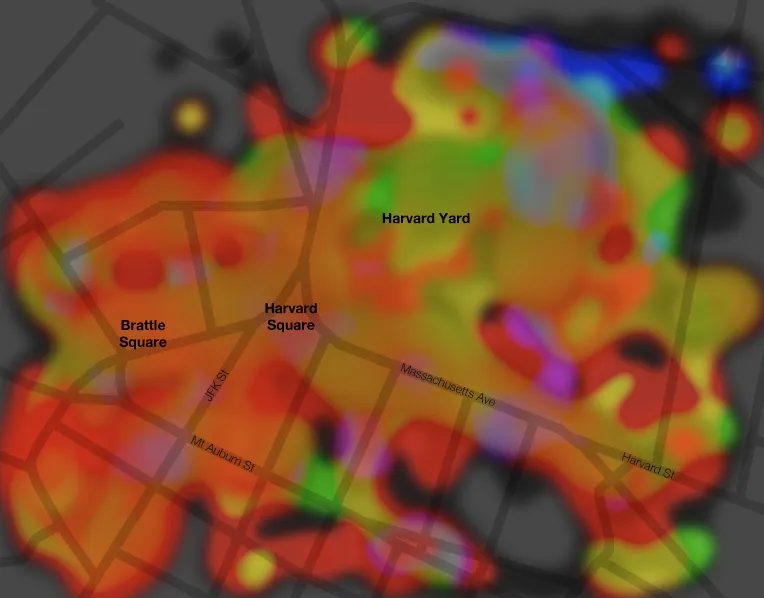
Clever visualization of Harvard’s campus. Cartographer Andy Woodruff harvested geotagged photographs via Flickr’s API, extracted each frame’s most prominent colors, and then merged and mapped these values to create a top-down average of street-level colors. Bricks make red, parks makes green, etc.